
Understanding correlation is crucial for analyzing data in various GMAT questions including Table Analysis questions in the new Data Insights section of the GMAT Focus Edition.
In this article, we will take up a 645+ level GFE official question and teach you a foolproof method that not only works on this difficult question but also on other official questions that test your understanding of correlation. FYI – Only 32% of students are able to answer this question correctly!
Navigating this article: If you are confident about your understanding of correlation, you may skip directly to section 2 in this article. And as you read the article, note carefully a common pitfall alert and then try your hand at a practice question at the end of the article!
Watch this video to understand what correlation is and how it works in GMAT table analysis questions
Ready to tackle the GMAT Focus Edition? e-GMAT offers a Personalized Study Planner and top-notch Free GFE mock exam to help you prepare effectively. As the most reviewed GMAT prep company on GMAT Club with 2600+ reviews we’re here to support your GMAT Focus journey. Take advantage of our free trial with the best quality content. Start your path to success today!
A simplistic View of Correlation
Let’s start with a basic understanding before diving into specific applications.
Simple Definition of Correlation: Correlation is a statistical measure that describes how two variables change relative to each other.
If one variable tends to increase as the other increases, or decrease as the other decreases, they are said to be correlated.
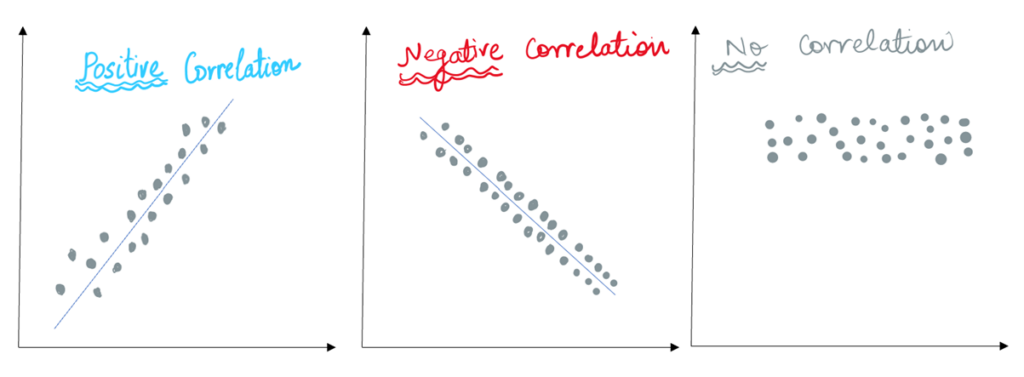
- Positive Correlation: A positive correlation occurs when two variables move in the same direction. As one variable increases, the other increases; as one decreases, the other does too. This relationship is often represented as a line graph where the line slopes upwards.
- Negative Correlation: In contrast, a negative correlation happens when two variables move in opposite direction. If one variable increases, the other decreases, and vice versa. In a line graph, this correlation would typically show a downward slope.
- No Correlation: No correlation means there is no discernible relationship between the movements of the two variables. In this case, a line graph would show a very flat or scattered pattern, indicating that the change in one variable has no predictable effect on the other.
Here is a simple graphic illustrating the positive, negative, and no correlation. (Simplistic view of correlation between two entities – one entity plotted on x-axis and the other on y-axis)
e-GMAT students learn the concept of correlation in a specialized Correlation module in which they learn, practice, and assess their conceptual understanding through three concept files and then they apply the conceptual understanding on two application files.
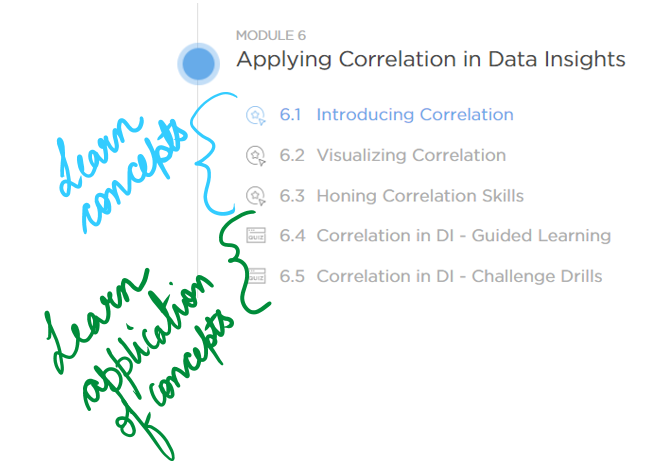
Table Analysis = Time-Saving on DI
Many people struggle with timing on the DI section. And GMAT Table Analysis questions offer excellent time-saving opportunities. e-GMAT students who master the process explained in this article are able to answer TA questions efficiently and accurately. So, mastering this process is the key to achieving high ability in DI section of the test.
Understanding Correlation from Tabulated Data
GMAT Table Analysis questions present an interesting challenge because of their very nature – they provide data in a tabular format. The question then becomes how we infer correlation from tables.
In this article through two official questions, you will learn time-saving strategies for effectively identifying correlations in tabulated data.
Let’s get started! Try your hand at this official question.
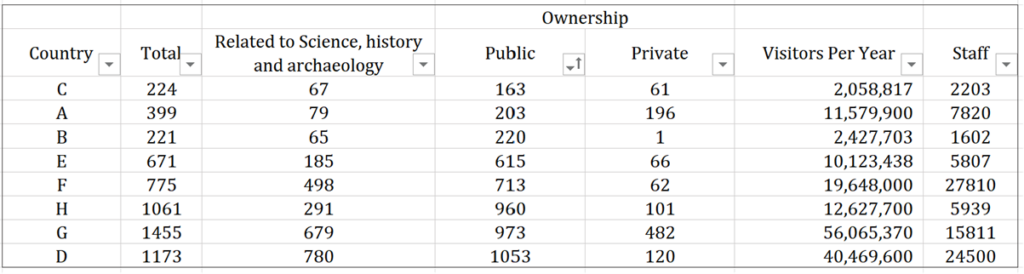
For each of the following statements, select True if the statement can be verified as true based on the information in the table. Otherwise, select False.
| True | False | Statement |
| ⚪ | ⚪ | The proportion of museums in D related to Science, History and Archaeology is greater than the proportion of museums in F devoted to the same. |
| ⚪ | ⚪ | The ratio of public museums to private museums is greatest for C. |
| ⚪ | ⚪ | There is a positive correlation between the number of public museums and the number of visitors per year. |
In this article, we will focus our attention on statement 3 since that statement pertains to correlation.
There is a positive correlation between the number of public museums and the number of visitors per year.
Step 1 : Identify the Two Datasets (Thorough Reading)
When we talk about correlation, the first step is crucial: identifying the two datasets that we are going to analyze. Remember: correlation is the analysis of how one set of data relates to another, and hence the need of two datasets. Also note that this aspect of correlation is fundamentally different from other statistical concepts that focus on a single data set, such as average, median, or standard deviation.
Correlation implies we need two datasets.
So, your first task is to identify the two datasets you need to evaluate for correlation. In this case, it’s the number of public museums and the number of visitors per year.
Let’s look at the table provided to find the columns of interest. Another point to note is that you will not always see the terms used in the statement directly reflected in the table’s headers. For example, here, instead of ‘number of public museums,’ the table has a column titled ‘public ownership.’ Similarly, the number of visitors is labeled as ‘visitors per year’ in the table. They mean the same here and all you needed was a minor mental translation to align the statement’s terms with the table’s columns.
Step 2 : Sort Any One Dataset
After identifying the datasets, remember to sort one of them. Without sorting, you cannot draw inference about directionality of the correlation. Remember, in a line chart, by virtue of one dataset being plotted on the x-axis, that dataset was already sorted. But in a table, we need to do this sorting explicitly.
To analyze the datasets for correlation, do explicit sorting.
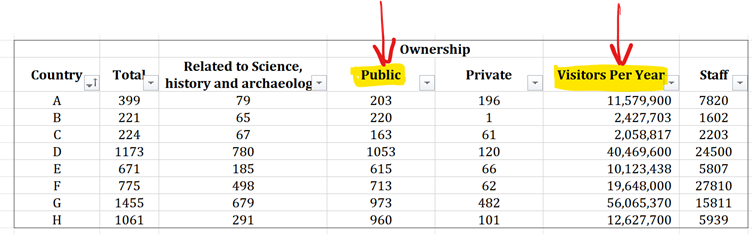
We have chosen to sort by “Public ownership.”
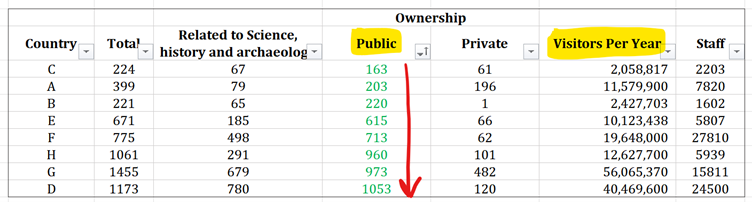
Step 3 : Observe the Directionality of the Other Dataset
Next, examine the directionality of the second dataset, “visitors per year.”
How should you do this? Do you need to consider each datapoint? Well, that would be too time consuming.
The efficient way to think about this is considering sets of values. To do that, divide your dataset into two halves. Check if the values in the top half (where “public ownership” values are smaller, since we sorted in ascending order) are generally smaller than those in the bottom half.
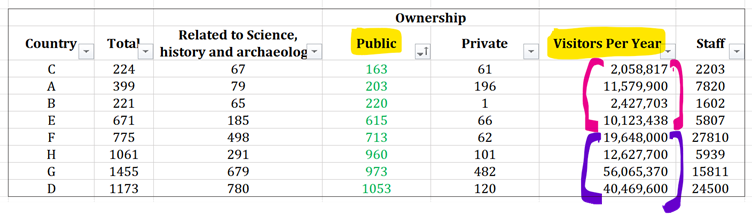
Here, we observe that the top half has about 2, 11, 2, and 10 (in millions) while the lower half has 19, 12, 56, and 40 (in millions). Clearly, the lower half has greater values compared to the upper half. This indicates Positive Correlation.
Time saving strategy: To infer type of correlation, instead of looking at each datapoint independently, divide the second dataset into two halves.
Avoid falling in this pitfall!
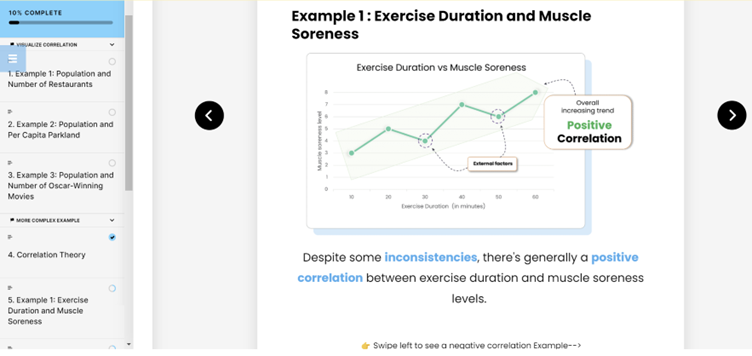
Do not make the mistake of considering some inconsistencies in data to mean that there is no correlation. For example, at points marked as 1 and 2 in the image below, the data does not follow the otherwise increasing trend. But despite such inconsistencies, at an overall level, there is positive correlation between these two variables.
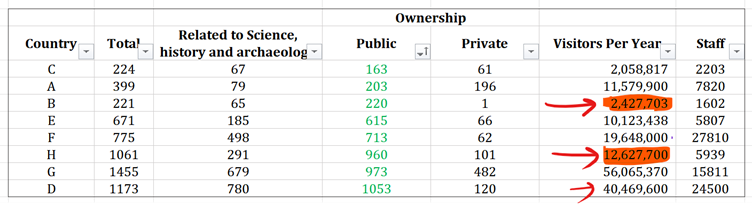
Such inconsistencies exist in many real-world scenarios. We explain them in detail in our correlation module.
Want to know where you stand on the GMAT Focus? Take our free GFE mock test and identify your baseline score. Get valuable insights into your performance, identify your strengths and weaknesses, and make an informed decision about your preparation path.
Learnings
Let’s recap the time-saving strategies to answer correlation related GMAT Table Analysis questions.
- Always begin by identifying the TWO datasets between which correlation needs to be inferred. Do not always expect a direct correspondence between statements and table columns. Actively apply translation skills at this stage.
- Always sort one of the columns: Inferring correlation without sorting one of the columns leads to wasted time and reduces the chances of answering the question correctly.
- To assess directionality in the second column split that column in halves: After sorting one column, split the second column in half. Focus on which half generally has larger numbers to deduce the correlation:
- Smaller numbers in the top half usually signal a positive correlation since the sorted column is in ascending order.
- Conversely, larger numbers in the top half often indicate a negative correlation.
- If both halves have similar numbers, this points to no correlation.
Do not confuse minor inconsistencies in data to mean no correlation: Real-world data is imperfect, and some inconsistencies are inevitable. Recognize these irregularities but concentrate on the overall trend to accurately infer the correlation.
Practice Question
Master the process outlined in this article to ensure that you achieve 100% accuracy in correlation related questions in Table Analysis of DI section of GFE. Table Analysis questions are a prime opportunity to save time during the GMAT’s DI section. Building proficiency in this area is essential not only to improve your accuracy but also to save time on the test.
Apply the following process on another official question:
- Identify the Two Datasets
- Sort One Column
- Split the Second Column into Two Halves
- Infer the Correlation
Dietician: Because of their chemical makeup, some oils are better suited for cooking at high heat than others. This is important because heating an oil above its smoke point—the temperature at which the oil begins to smoke—produces toxic fumes and free radicals, which can be harmful. Refined oils are highly processed with chemicals and should be avoided. Here are some recommendations for suitable uses of oils based on their heat type.
- No heat—use these oils on salads or as condiments
- Low heat—use these oils for sauces and for baking
- Medium heat—use these oils for light sautéing
- High heat—use these oils for browning and frying
The table lists information about the oils that Mariano is considering buying after reading the dietician’s advice. The table also includes the amount of each oil per container and the price for that amount of oil.
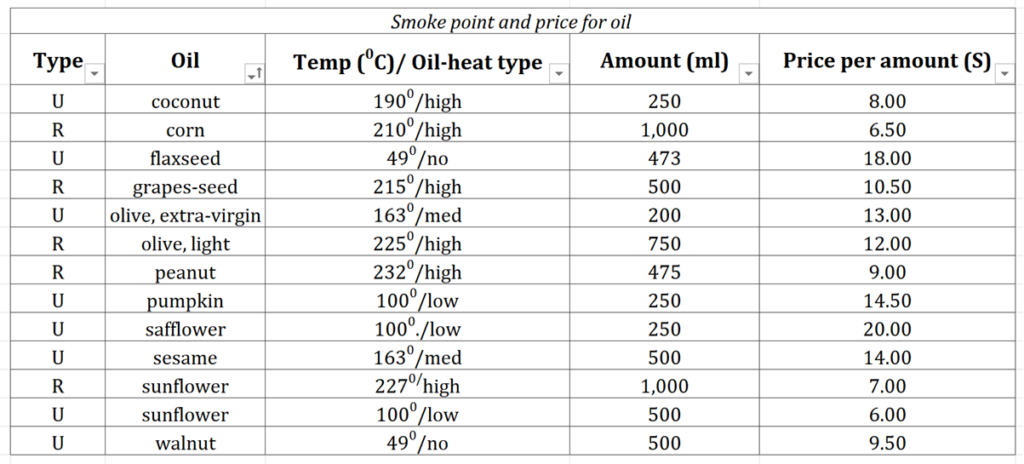
For each of the following statements, select True if the statement can be verified as true based on the information in the table. Otherwise, select False.
| True | False | Statement |
| ⚪ | ⚪ | Among the oils listed that are of the type the dietician recommends for frying, there is only one that Mariano can choose if he follows all of the dietician’s advice. |
| ⚪ | ⚪ | Grape-seed oil has the greatest price per ml of all high-heat oils listed. |
| ⚪ | ⚪ | Among the oils on the list, there is a strong positive correlation between the amount per container (in ml) and the price for the container (in dollars). |
Here is the link to the solution for the above mentioned practice question.
Further honing : GMAT Table Analysis
Sometimes tables include “average” row and that provides additional time-saving opportunities. Stay tuned for the next article in which we discuss the same.
Further, we suggest you to read below articles:
- Correlation Unveiled: A Tactical Approach to GMAT Table Analysis questions – Part 2
- Unraveling GFE’s DI Table Analysis: Every Complex Statement Has a Simpler Twin!
- Multi-Source Reasoning || e-GMAT’s MSR course
- Embarking on the Journey to Table Analysis and Graphical Interpretation Mastery
Start your GMAT Focus journey with our free GMAT Focus mock test to gauge your baseline score, and then create a personalized study plan. Dive into our free trial for targeted prep. Trusted by thousands with 2600+ reviews on GMAT Club, e-GMAT is your partner in mastering the GMAT. Contact us at support@e-gmat.com for expert guidance.