Why should you read this article?
A 5-minute investment right now can equip you with an ironclad way to approach correlation questions asked in Table Analysis questions found within the Data Insights section of the GMAT Focus Edition. Extract all the learnings you can from this 645+ (use hard or 700 level) level official question that only 45% of students answer correctly while spending more than 2.5 minutes on this question.
If you have a thorough understanding of the correlation concept in table analysis questions, you should skip ahead to section 3.
Want to know where you stand on the GMAT Focus? Take our free GFE mock test and identify your baseline score. Get valuable insights into your performance, identify your strengths and weaknesses, and make an informed decision about your preparation path.
What is Correlation – Quick review
Correlation measures the relationship between two variables: positive correlation shows movement in the same direction, negative correlation indicates movement in opposite directions, and no correlation reflects no predictable pattern between the variables.
Click here to read the Correlation Unveiled: A Tactical Approach to GMAT Table Analysis – Part 1
How to Infer Correlation from Tabulated Data
Inferring correlation between two entities when the data is presented in a tabulated manner in DI Table Analysis questions requires a specialized process, as presented below and discussed in detail in this article, with application on two difficult official questions.
- Identify the Two Datasets – correlation is always between two datasets!
- Sort One Column – it’s a must!
- Split the Second Column into Two Halves – a time-saving technique that ensures you don’t make any errors.
- Infer the Correlation – your deduction skills are at play here!
Now, it’s time to build upon this process and add another tool to our arsenal.
Official Question under focus
Try your hand at this 645+ level official Table analysis question that has an accuracy of only 45%.
Question
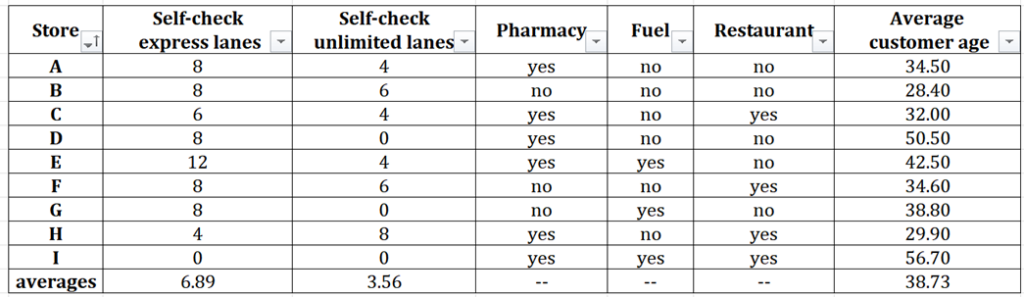
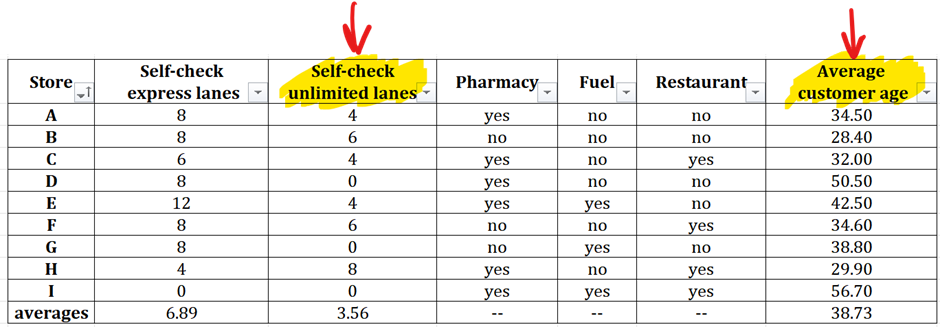
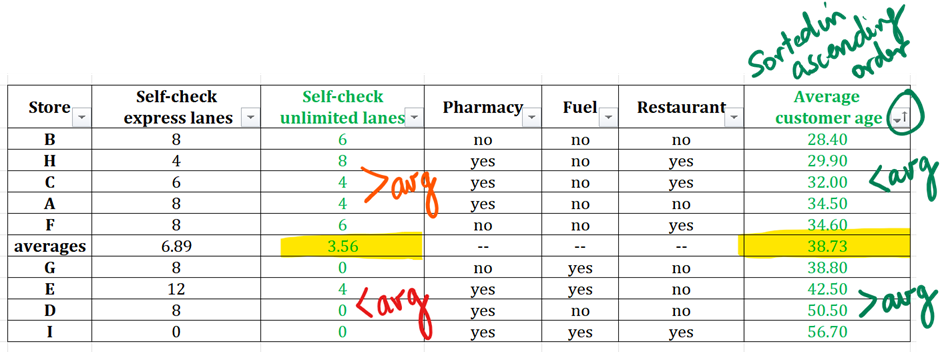
The table summarizes information in several categories about the 9 stores in a small grocery chain. The table also includes chain-wide averages where appropriate.
For each of the following statements, select True if the statement can be verified to be true based on the information provided. Otherwise, select False.
| True | False | Statement |
| ⚪ | ⚪ | In each store whose average customer age falls between 34 and 36, the number of self-check express lanes is above average. |
| ⚪ | ⚪ | There is a negative correlation between the number of self-check unlimited lanes and the average customer age. |
| ⚪ | ⚪ | Stores in this table that have fewer self-check express lanes than the chain-wide average are less likely to have restaurants than stores that have more self-check express lanes than the chain-wide average. |
We will focus our attention on statement 2 – There is a negative correlation between the number of self-check unlimited lanes and the average customer age.
Watch this video to see the application of Correlation:
Step-by Step Solution
Step 1 : Identify the Two Datasets (Thorough Reading)
When discussing correlation in Table analysis questions, the initial step is paramount: pinpointing the two sets of data for examination. It’s important to keep in mind that correlation involves examining the relationship of one data set with another, requiring the presence of two distinct datasets. Additionally, it’s key to understand that this characteristic of correlation sets it apart from other statistical measures that concentrate on analyzing a single data set, like mean, median, or standard deviation.
Correlation is always between two datasets.
So, your first task is to identify the two datasets you need to evaluate for correlation. In this case, it’s the number of self-check unlimited lanes and the average customer age.
Let’s look at the table provided to find the columns of interest.
Be careful when identifying the column “Self-check unlimited lanes.” Do not mistakenly identify the adjacent column with same first and last words “self-check express lanes”. Such mistakes happen with students who are not completely immersed in the dataset – who do not own the dataset.
Step 2 : Sort Any One Dataset
Now onto the next critical step and next decision point – which of the two columns to sort? Remember, TA questions offer us the opportunity to save on time that we can utilize for more time-consuming questions such as MSR.
Between these two columns, I will sort by average customer age since these numbers with two digits and decimals are more difficult to read as compared to the single digit numbers in the self-check unlimited lanes. So, the basic principle is that you sort by the column that has harder to analyze numbers so that you observe easier numbers to draw your inferences about correlation.
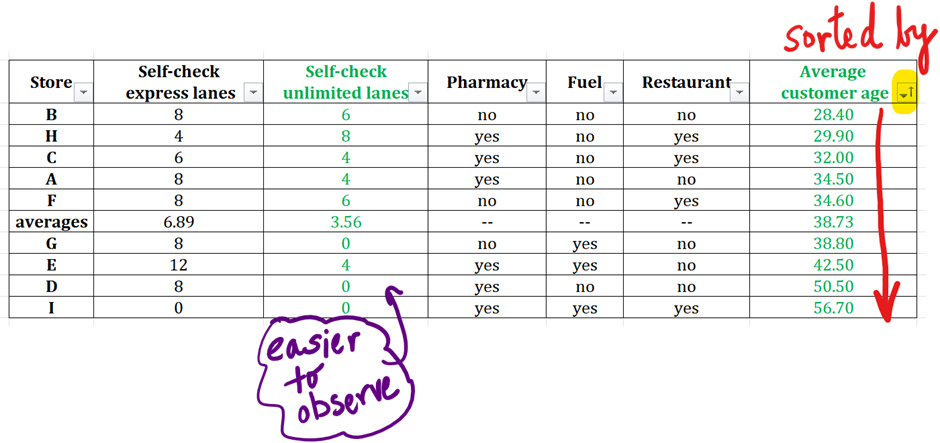
For analysis of correlation, sort by the column that has ‘harder to observe’ numbers.
Step 3 : Observe the Directionality of the Other Dataset
Next, examine the directionality of the second dataset, “self-check unlimited lanes.”
Instead of reading each value, we consider two sets of values. To do that, we divide the dataset into two halves, and we check if the values in the top half (where “average age” values are smaller since we sorted them in ascending order) are generally smaller than those in the bottom half.
But in this case, we have another tool at our disposal. Observe the average row. Instead of splitting the table into two halves, we use the “average” row as the boundary for comparison. Let’s see how this average row can be used for the basis of comparison to determine the directionality of the other dataset – self-check unlimited lanes – in this example.
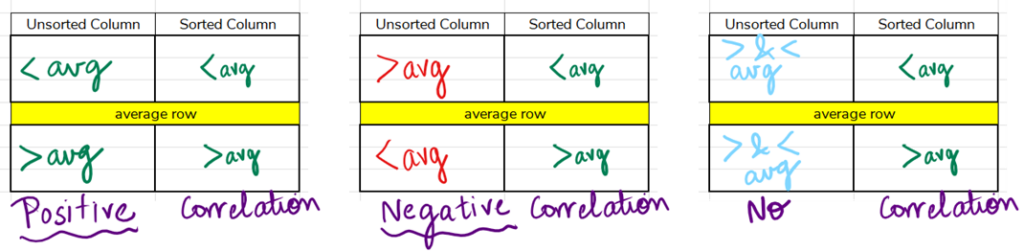
- If the values above the average row are smaller than the average and if the values below the average row are larger, then there is positive correlation. This is because the sorted dataset also has smaller values above this average row since we sorted in ascending order.
- If the values above the average row are larger than the average and the values below the average row are smaller, then there is negative correlation.
- If there is no discernable trend above and below the average, then there is no correlation.
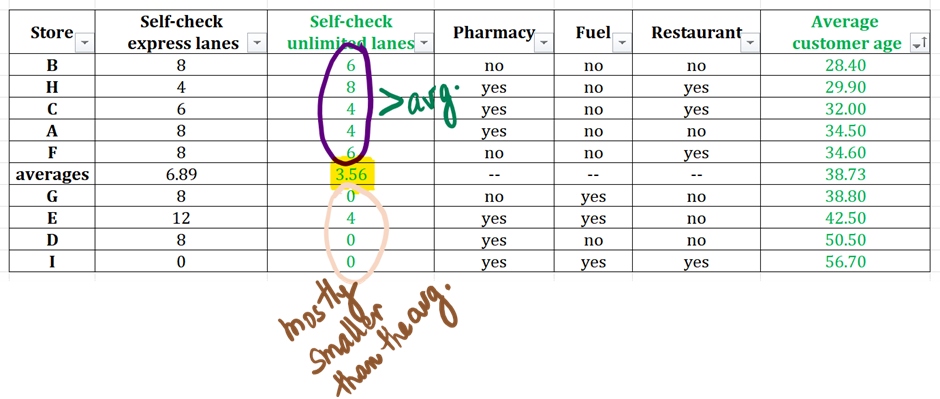
Observe how the values in the cells above the average are larger than the average 3.56. And the values below the average cell are mostly smaller than the average – 3 data points with 0 and only one with 4 – an imperfection that is absolutely acceptable when we are considering correlation since correlation deals with general trends in the datasets.
Such inconsistencies exist in most real-world scenarios. We explain them in detail in our correlation module.
Conclusion
The two datasets are negatively correlated.
Learnings (Table Analysis Questions)
In this article, we fine-tuned the process that we learned in this article by utilizing multiple opportunities presented by the dataset in such official question, such as the “averages” row. We will show the fine-tuning at two steps – step 2 and 3.
- Identify the Two Datasets
- Sort One Column
- Observe the directionality of the other dataset
- Infer the Correlation
Fine-tuning at step 2 – Sort one column.
- For sorting, choose the column that has harder-to-read numbers, such as numbers with decimals. This will allow you to analyse the column that has easier-to-read numbers.
Fine tuning at step 3 – Observe the directionality of the un-sorted column.
- Typically, we divide the column into two halves, and we compare the magnitude of the two halves. In some cases, when an average row is also given, we can save time by comparing the numbers in the cells above the average and below the average.
- If the values above the average row are smaller than the average and if the values below the average row are larger, then there is a positive correlation. This is because the sorted dataset also has smaller values above this average row since we sorted in ascending order.
- If the values above the average row are larger than the average and the values below the average row are smaller, then there is a negative correlation.
- If there is no discernable trend above and below the average, then there is no correlation.
As you practice Data Insights questions, be on the look-out of such time-saving techniques. Analysing data is a very rewarding experience. Make the most of it as you prepare for Data Insights. This is your chance to invest in building this life skill!
Happy Learning!
Ready to tackle the GMAT Focus Edition? e-GMAT offers a Personalized Study Planner and top-notch Free GFE mock exam to help you prepare effectively. As the most reviewed GMAT prep company on GMAT Club with 2600+ reviews we’re here to support your GMAT Focus journey. Take advantage of our free trial with the best quality content. Start your path to success today!