
Introduction
In this article, we will present a GMAT table analysis practice question, complete with a solution that applies the concept of correlation.
Comprehending correlation is essential for interpreting data in a range of GMAT questions, particularly in Table Analysis questions found within the Data Insights section of the GMAT Focus Edition.
As you know, correlation measures the relationship between two variables: positive correlation shows movement in the same direction, negative correlation indicates movement in opposite directions, and no correlation reflects no predictable pattern between the variables.
Inferring correlation between two entities when the data is presented in a tabulated manner in DI Table Analysis questions requires a specialized process as presented below.
- Identify the Two Datasets
- Sort One Column
- Split the Second Column into Two Halves
- Infer the Correlation
In this article, we will apply the process above on the official question.
Click here to read the Main Article – Correlation Unveiled: A Tactical Approach to GMAT Table Analysis – Part 1
Official Question
Dietician: Because of their chemical makeup, some oils are better suited for cooking at high heat than others. This is important because heating oil above its smoke point—the temperature at which the oil begins to smoke—produces toxic fumes and free radicals, which can be harmful. Refined oils are highly processed with chemicals and should be avoided. Here are some recommendations for suitable uses of oils based on their heat type.
- No heat—use these oils on salads or as condiments
- Low heat—use these oils for sauces and for baking
- Medium heat—use these oils for light sautéing
- High heat—use these oils for browning and frying
The table lists information about the oils that Mariano is considering buying after reading the dietician’s advice. The table also includes the amount of each oil per container and the price for that amount of oil.
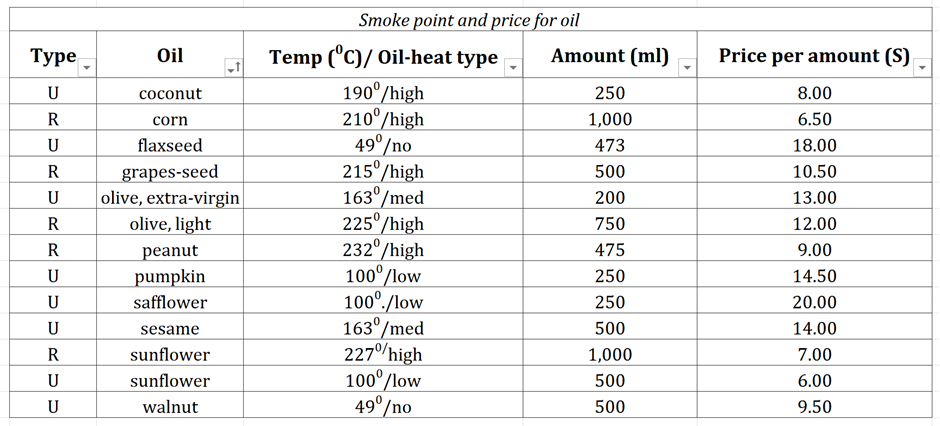
| True | False | Statement |
| ⚪ | ⚪ | Among the oils listed that are of the type the dietician recommends for frying, there is only one that Mariano can choose if he follows all of the dietician’s advice. |
| ⚪ | ⚪ | Grape-seed oil has the greatest price per ml of all high-heat oils listed. |
| ⚪ | ⚪ | Among the oils on the list, there is a strong positive correlation between the amount per container (in ml) and the price for the container (in dollars). |
Please watch this video for the solution and to understand the application of correlation in GMAT Table Analysis practice questions :
Applying the process to infer correlation
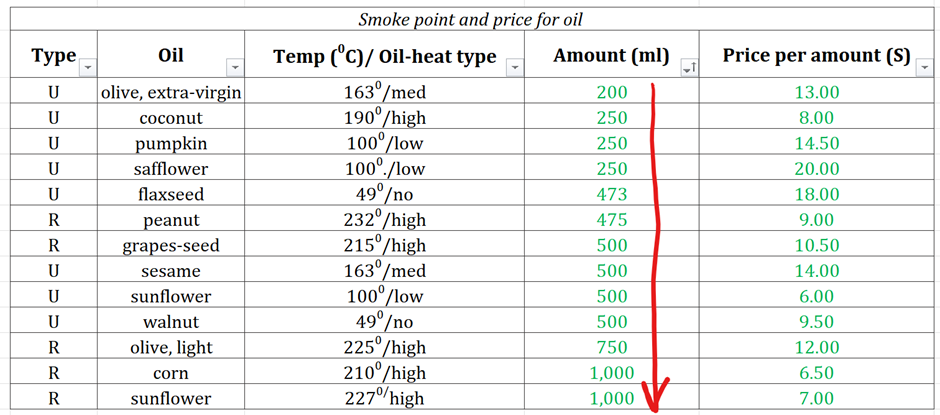
1. Identify the Two Datasets
According to the statement, we need to determine the correlation between the ‘amount per container’ and ‘the price for the container.’ In the table, these correspond to the columns labeled ‘Amount’ and ‘Price per Amount.’ This identification step is straightforward.
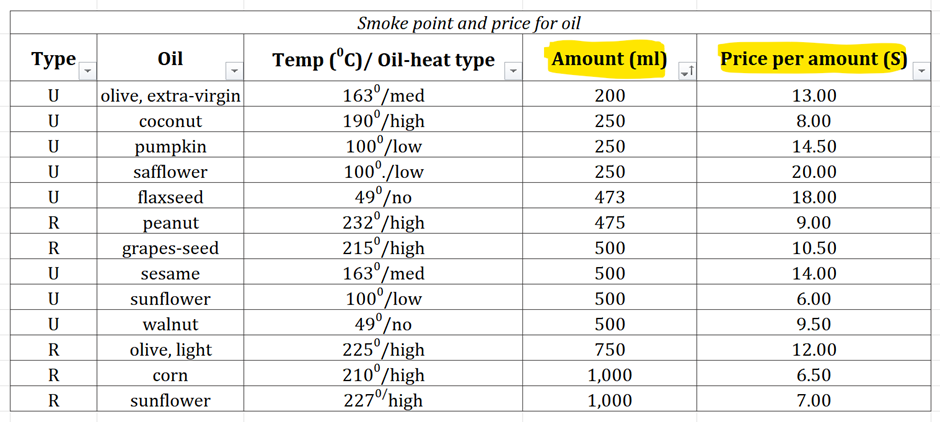
2. Sort One Column
We will sort the ‘Amount‘ column. Sorting this column will help us better observe the relationship with ‘Price per Amount.’
3. Split the Second Column into Two Halves and Observe
After sorting ‘Amount,’ we divide the ‘Price per Amount’ column into two halves (or approximate halves). The top half contains larger values, such as 20, 14.5, 18, while the bottom half includes smaller values, mostly under 15, with many single-digit figures. This observation is key to determining the trend.
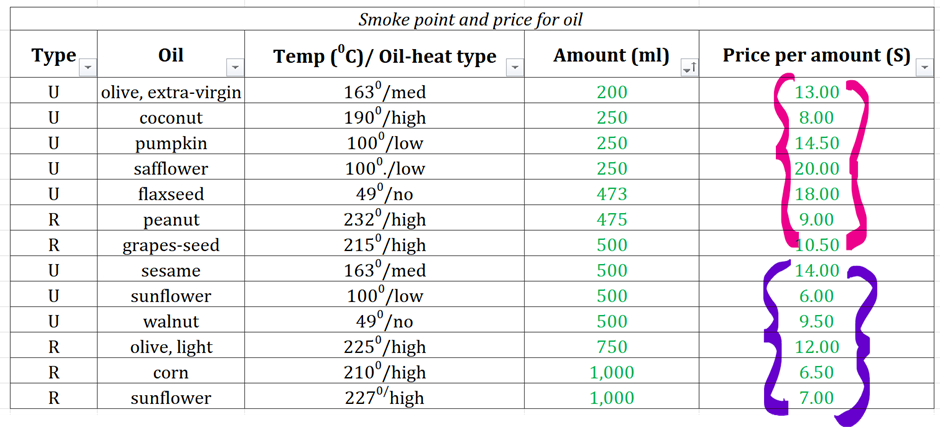
4. Infer the Correlation
The fact that the top half of the ‘Price per Amount’ column has larger values than the bottom half suggests a negative correlation. This means as the ‘Amount’ increases, the ‘Price per Amount’ tends to decrease. While there are some inconsistencies marked in the table, the overall trend is a decrease.
Conclusion
By following these steps with precision, we can see that there is a negative correlation between the amount per container and the price for the container in this GMAT Table analysis question. Even though there are inconsistencies in the data, the general trend is clear and supports our inference. This kind of analysis is invaluable for GMAT Table Analysis questions, where quickly identifying trends and correlations can save crucial time and enhance accuracy.
Want to know where you stand on the GMAT Focus? Take our free GFE mock test and identify your baseline score. Get valuable insights into your performance, identify your strengths and weaknesses, and make an informed decision about your preparation path.