![GMAT Scores & Percentiles 2025: GMAT Score Calculator & Chart [Updated Aug 2025]](https://cdn.e-gmat.com/blogs/wp-content/uploads/2025/06/GMAT-Score-Chart-2025-1280x640.jpeg)
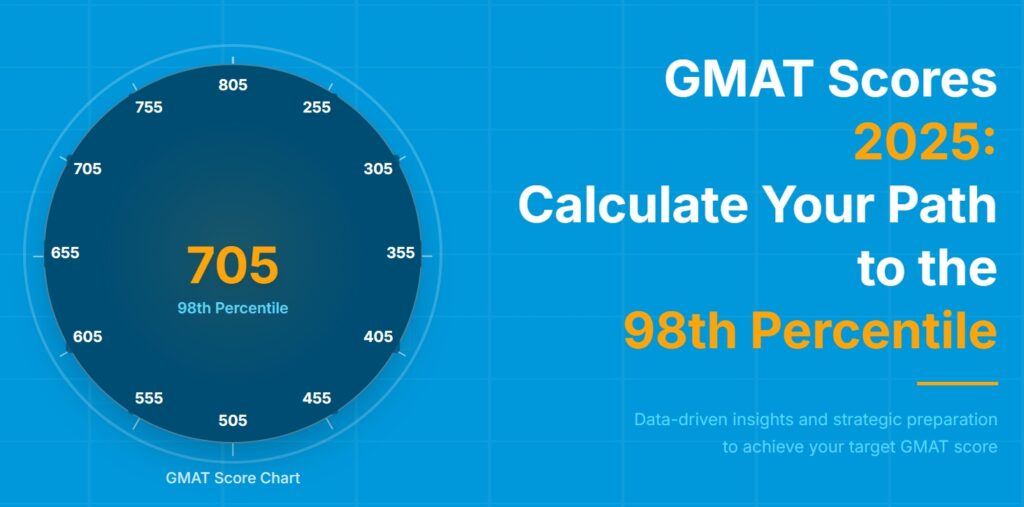
Looking for an accurate way to evaluate your GMAT performance? Our comprehensive GMAT score calculator helps you determine your exact percentile ranking across all sections. Whether you’re wondering if your 705 puts you in the 98th percentile or trying to calculate what sectional scores you need to achieve your target percentile, this guide provides detailed GMAT score charts and GMAT percentiles for 2025. Understanding these percentiles is critical because a single GMAT score point could represent a meaningful difference between you and thousands of other MBA applicants.
While many test-takers obsess over reaching arbitrary score thresholds, few grasp the sophisticated GMAT scoring architecture. This system determines how business schools interpret their performance. In this comprehensive analysis, we’ll decode the complete GMAT score distribution, reveal exactly how the scoring system works, and provide strategic insights to help you leverage this knowledge in your MBA application journey.
GMAT Score Chart Calculator
Enter your sectional scores in the calculator and get your total GMAT score, percentile ranking as well as a PERSONALISED ROADMAP and insights for your GMAT journey!
How long will YOU need to master these topics?
The syllabus is the same for everyone—but your timeline isn’t. In 5 minutes, get a personalized plan based on your target score and starting point.
How Long Do You Need
to Score 705?
Get a personalized study timeline
Based on your current level and target score
Know which section to prioritize
Quant, Verbal, or DI — see where to focus first
Define your target percentiles
Clear metrics for each section to hit your goal
- GMAT Score Chart Calculator
- How long will YOU need to master these topics?
- How is the GMAT Focus Edition Scored: Key Takeaways
- GMAT Percentile Updates 2025: What Changed and What It Means for You
- GMAT Score Chart: Total Score and Percentile
- GMAT Score Chart: Section Scores Breakdown
- How Does the GMAT Scoring System Benefit Applicants: Strategic Implications
- Key Benefits of GMAT Scoring for Different Stakeholders
- How is the GMAT Total Score Calculated?
- GMAT Study Plan Based on Score Goals
- Conclusion
- FAQs
How is the GMAT Focus Edition Scored: Key Takeaways

Equal Weights across all sections: The GMAT Focus Edition features equal weighting across all three sections (Quant, Verbal and Data Insights) , with integrated scoring (205-805) and no writing assessment.
Superior Scoring Precision in GMAT Focus: The GMAT delivers 2.5X more precision than the GRE at higher score ranges, giving you a significant advantage when applying to competitive programs. This exceptional granularity means you can reach the elite 95th-99th percentile by being extremely strong in just one section and reasonably strong in others—an opportunity not available with less precise tests. You will learn about the scoring levels and their importance in detail here in the article.
More Accurate Overall Assessment: GMAT Focus’s precise scoring system creates meaningful distinctions between candidates at all levels, eliminating the “clustering” effect where top performers receive identical scores. For example, the Data Insights section demonstrates exceptional granularity at the top percentiles. With precise scoring increments of 1 point, this section offers 8 distinct scores in the 96-100 percentile range alone, allowing for meaningful differentiation among top performers. You will get a detailed understanding for each section here.
Competitive Advantage: If you’re targeting elite MBA programs where applicants cluster at high score ranges like Harvard or Stanford where median scores are at the 96th percentile, the GMAT’s finer granularity helps you stand out more effectively. Even at the 96th percentile, GMAT gives you 14 scoring points to showcase your candidacy more effectively by highlighting your specific abilities rather than grouping you with many other high performers.
Linear Scoring Architecture: The GMAT uses a predictable linear system where your overall score directly correlates to the sum of your three sectional scores (Quant, Verbal and DI). Understanding this relationship gives you a powerful strategic advantage—you can precisely aim for your target sectional scores based on your strengths, potentially saving weeks of misdirected preparation. We’ll explain this critical concept in detail later.
GMAT Percentile Updates 2025: What Changed and What It Means for You
New Percentile Changes – The Big Picture
GMAC just released updated GMAT percentiles, and while the changes aren’t dramatic, they’re important enough that you need to know about them. The good news? The GMAT scoring system has proven incredibly robust over 2 years and 300,000+ data points.
But there are two key changes that might impact your strategy.
The Two Major Changes You Need to Know
| 1. 695 is now the new 740 (97th percentile) | 2. 635 is the new 80th percentile benchmark |
| Previously: 695 = 98th percentile (equivalent to old 750) | Previously: 625 = 80th percentile |
| Now: 695 = 97th percentile (equivalent to old 740) | Now: 635 = 80th percentile |
| Impact: If you’re aiming for that elite 98th percentile, you’ll now need a 705 | Impact: The 80th percentile threshold has shifted up by 10 points |
What Hasn’t Changed (And Why That’s Great News)
If you’re scoring at the very top, breathe easy:
- 99th percentile: Still 715
- 100th percentile: Still 735
- 98th percentile: Still 705 (this is why 695 scorers need to pay attention)
Most importantly, Quant percentiles haven’t budged. Your benchmarks remain rock solid:
- 90th percentile = Q86
- 80th percentile = Q83
- 70th percentile = Q81
Where Did the Changes Come From?
The shifts are primarily driven by Verbal section performance. More test-takers are scoring in the V77-V84 range, creating what we call a “percentile tug” in this middle band. However, if you’re scoring V85 or higher, your percentiles remain unchanged.
Data Insights shows minimal change – just a one-percentile shift at lower scores that doesn’t impact high performers.
What This Means for You
If You’ve Already Taken the GMAT:
| Celebrate if you have: | Take action if you have: |
| 715+: You’re still at 99th percentile – nothing’s changed | 695: You’ve dropped from 98th to 97th percentile. Consider: ✅ Strengthening other parts of your application ✅ Retaking only if scholarships are crucial (aim for 705) ✅ Applying in Round 1 with your current score, then potentially retesting |
| 705: You’re actually better off now – fewer people share your 98th percentile | 625-635: If targeting top schools, you now have extra motivation to push higher |
| 645-685: Your percentiles remain the same |
If You’re Still Preparing:
Adjust your targets:
- Were aiming for 695? → Now aim for 705 (just one more point in any section!)
- Were aiming for 625? → Now aim for 635 to hit that 80th percentile
- Were aiming for 715+? → No change needed
The strategic approach: Since the changes are primarily in Verbal, consider focusing an extra week on verbal preparation if you’re in the affected score ranges. Remember, just one additional point in any section can make the difference.
The Bottom Line
These percentile adjustments are minor fine-tuning, not major overhauls. The GMAT scoring system has proven remarkably stable, which is excellent news for test-takers. The key takeaway? If you’re in that 695 or 625-635 range, you might want to push just a bit harder. For everyone else, stay the course – your targets remain the same.
Most importantly, don’t panic. These are single percentile point changes that reflect the natural evolution of the test-taking population. Focus on your strengths, prepare strategically, and remember that your GMAT score is just one component of your overall application.
GMAT Score Chart: Total Score and Percentile
The GMAT score chart below shows the complete score distribution with corresponding percentile rankings based on data from 2019-2024 with a sample size of 596,155 test-takers. Use this comprehensive chart to understand where your score stands relative to other test-takers.
GMAT Score Chart: Total Score and Percentile Ranking
| Score | Percentile Ranking |
| 805 | 100% |
| 795 | 100% |
| 785 | 100% |
| 775 | 100% |
| 765 | 100% |
| 755 | 100% |
| 745 | 100% |
| 735 | 100% |
| 725 | 99% |
| 715 | 99% |
| 705 | 98% |
| 695 | 97% |
| 685 | 96% |
| 675 | 95% |
| 665 | 92% |
| 655 | 91% |
| 645 | 87% |
| 635 | 82% |
| 625 | 79% |
| 615 | 76% |
| 605 | 70% |
| 595 | 67% |
| 585 | 61% |
| 575 | 57% |
| 565 | 51% |
| 555 | 48% |
| 545 | 42% |
| 535 | 39% |
| 525 | 34% |
| 515 | 32% |
| 505 | 27% |
| 495 | 25% |
| 485 | 21% |
| 475 | 20% |
| 465 | 17% |
| 455 | 15% |
| 445 | 13% |
| 435 | 12% |
| 425 | 10% |
| 415 | 9% |
| 405 | 7% |
| 395 | 6% |
| 385 | 5% |
| 375 | 5% |
| 365 | 4% |
| 355 | 3% |
| 345 | 3% |
| 335 | 2% |
| 325 | 2% |
| 315 | 1% |
| 305 | 1% |
| 295 | 1% |
| 285 | 1% |
| 275 | 1% |
| 265 | 1% |
| 255 | 0% |
| 245 | 0% |
| 235 | 0% |
| 225 | 0% |
| 215 | 0% |
| 205 | 0% |
Score Granularity at High Percentile Levels

The GMAT Focus Edition demonstrates exceptional scoring granularity, particularly at high percentile levels:
- 99th-100th Percentile Range: 10 distinct scores (715-805)
- 96th-98th Percentile Range: 3 distinct scores (685-705)
- 90th-95th Percentile Range: 3 distinct scores (655-675)
This level of differentiation provides significant advantages to high-performing candidates compared to less granular scoring systems.
Why Scoring Granularity Matters for Overall GMAT Scores
The GMAT Focus Edition’s finer granularity means business schools can better distinguish between candidates with exceptional abilities across all tested areas. This precision is particularly crucial at the high end of the scoring range where many competitive applicants cluster.
For example, imagine three MBA applicants with different overall abilities:
- Applicant A has truly exceptional skills (99th percentile)
- Applicant B has excellent skills (98th percentile)
- Applicant C has very strong skills (96th percentile)
On the GMAT Focus Edition, these applicants would receive different scores (725, 705, and 685 respectively), clearly signaling their different abilities to admissions committees.
GMAT Score Chart: Section Scores Breakdown
The GMAT Focus Edition’s exceptional granularity extends beyond the Total Score to each individual section. Below are the complete percentile distributions for all three sections, providing a detailed GMAT section scores breakdown.
Section Score & Percentile Rankings
Your pathway to GMAT excellence starts here
| QUANT SCORE | PERCENTILE |
|---|---|
| 90 Perfect | |
| 89 | |
| 88 | |
| 87 | |
| 86 | |
| 85 Top 12% | |
| 84 | |
| 83 | |
| 82 | |
| 81 | |
| 80 | |
| 79 | |
| 78 Median | |
| 77 | |
| 76 | |
| 75 | |
| 74 | |
| 73 | |
| 72 | |
| 71 | |
| 70 | |
| 69 | |
| 68 | |
| 67 | |
| 66 | |
| 65 | |
| 64 | |
| 63 | |
| 62 | |
| 61 | |
| 60 | |
| VERBAL SCORE | PERCENTILE |
|---|---|
| 90 Perfect | |
| 89 | |
| 88 | |
| 87 | |
| 86 | |
| 85 Top 6% | |
| 84 | |
| 83 | |
| 82 | |
| 81 | |
| 80 | |
| 79 | |
| 78 | |
| 77 | |
| 76 | |
| 75 | |
| 74 | |
| 73 | |
| 72 | |
| 71 | |
| 70 | |
| 69 | |
| 68 | |
| 67 | |
| 66 | |
| 65 | |
| 64 | |
| 63 | |
| 62 | |
| 61 | |
| 60 | |
| DATA INSIGHTS SCORE | PERCENTILE |
|---|---|
| 90 Perfect | |
| 89 | |
| 88 | |
| 87 | |
| 86 | |
| 85 | |
| 84 | |
| 83 | |
| 82 | |
| 81 | |
| 80 | |
| 79 | |
| 78 | |
| 77 | |
| 76 | |
| 75 | |
| 74 | |
| 73 | |
| 72 | |
| 71 | |
| 70 | |
| 69 | |
| 68 | |
| 67 | |
| 66 | |
| 65 | |
| 64 | |
| 63 | |
| 62 | |
| 61 | |
| 60 | |
Find Your Score
Granularity Levels Across Sections
Examining the section scores reveals remarkable granularity throughout the GMAT Focus Edition:
Quantitative Reasoning
With 7 distinct scores in the 85-100th percentile range for Quant, the GMAT provides a more precise measurement of mathematical ability, especially at higher scores, creating a clear pathway for improvement that’s unmatched by other tests.
The graph below showcases how you can directly improve your total GMAT percentile by just increasing your quants score at each point.
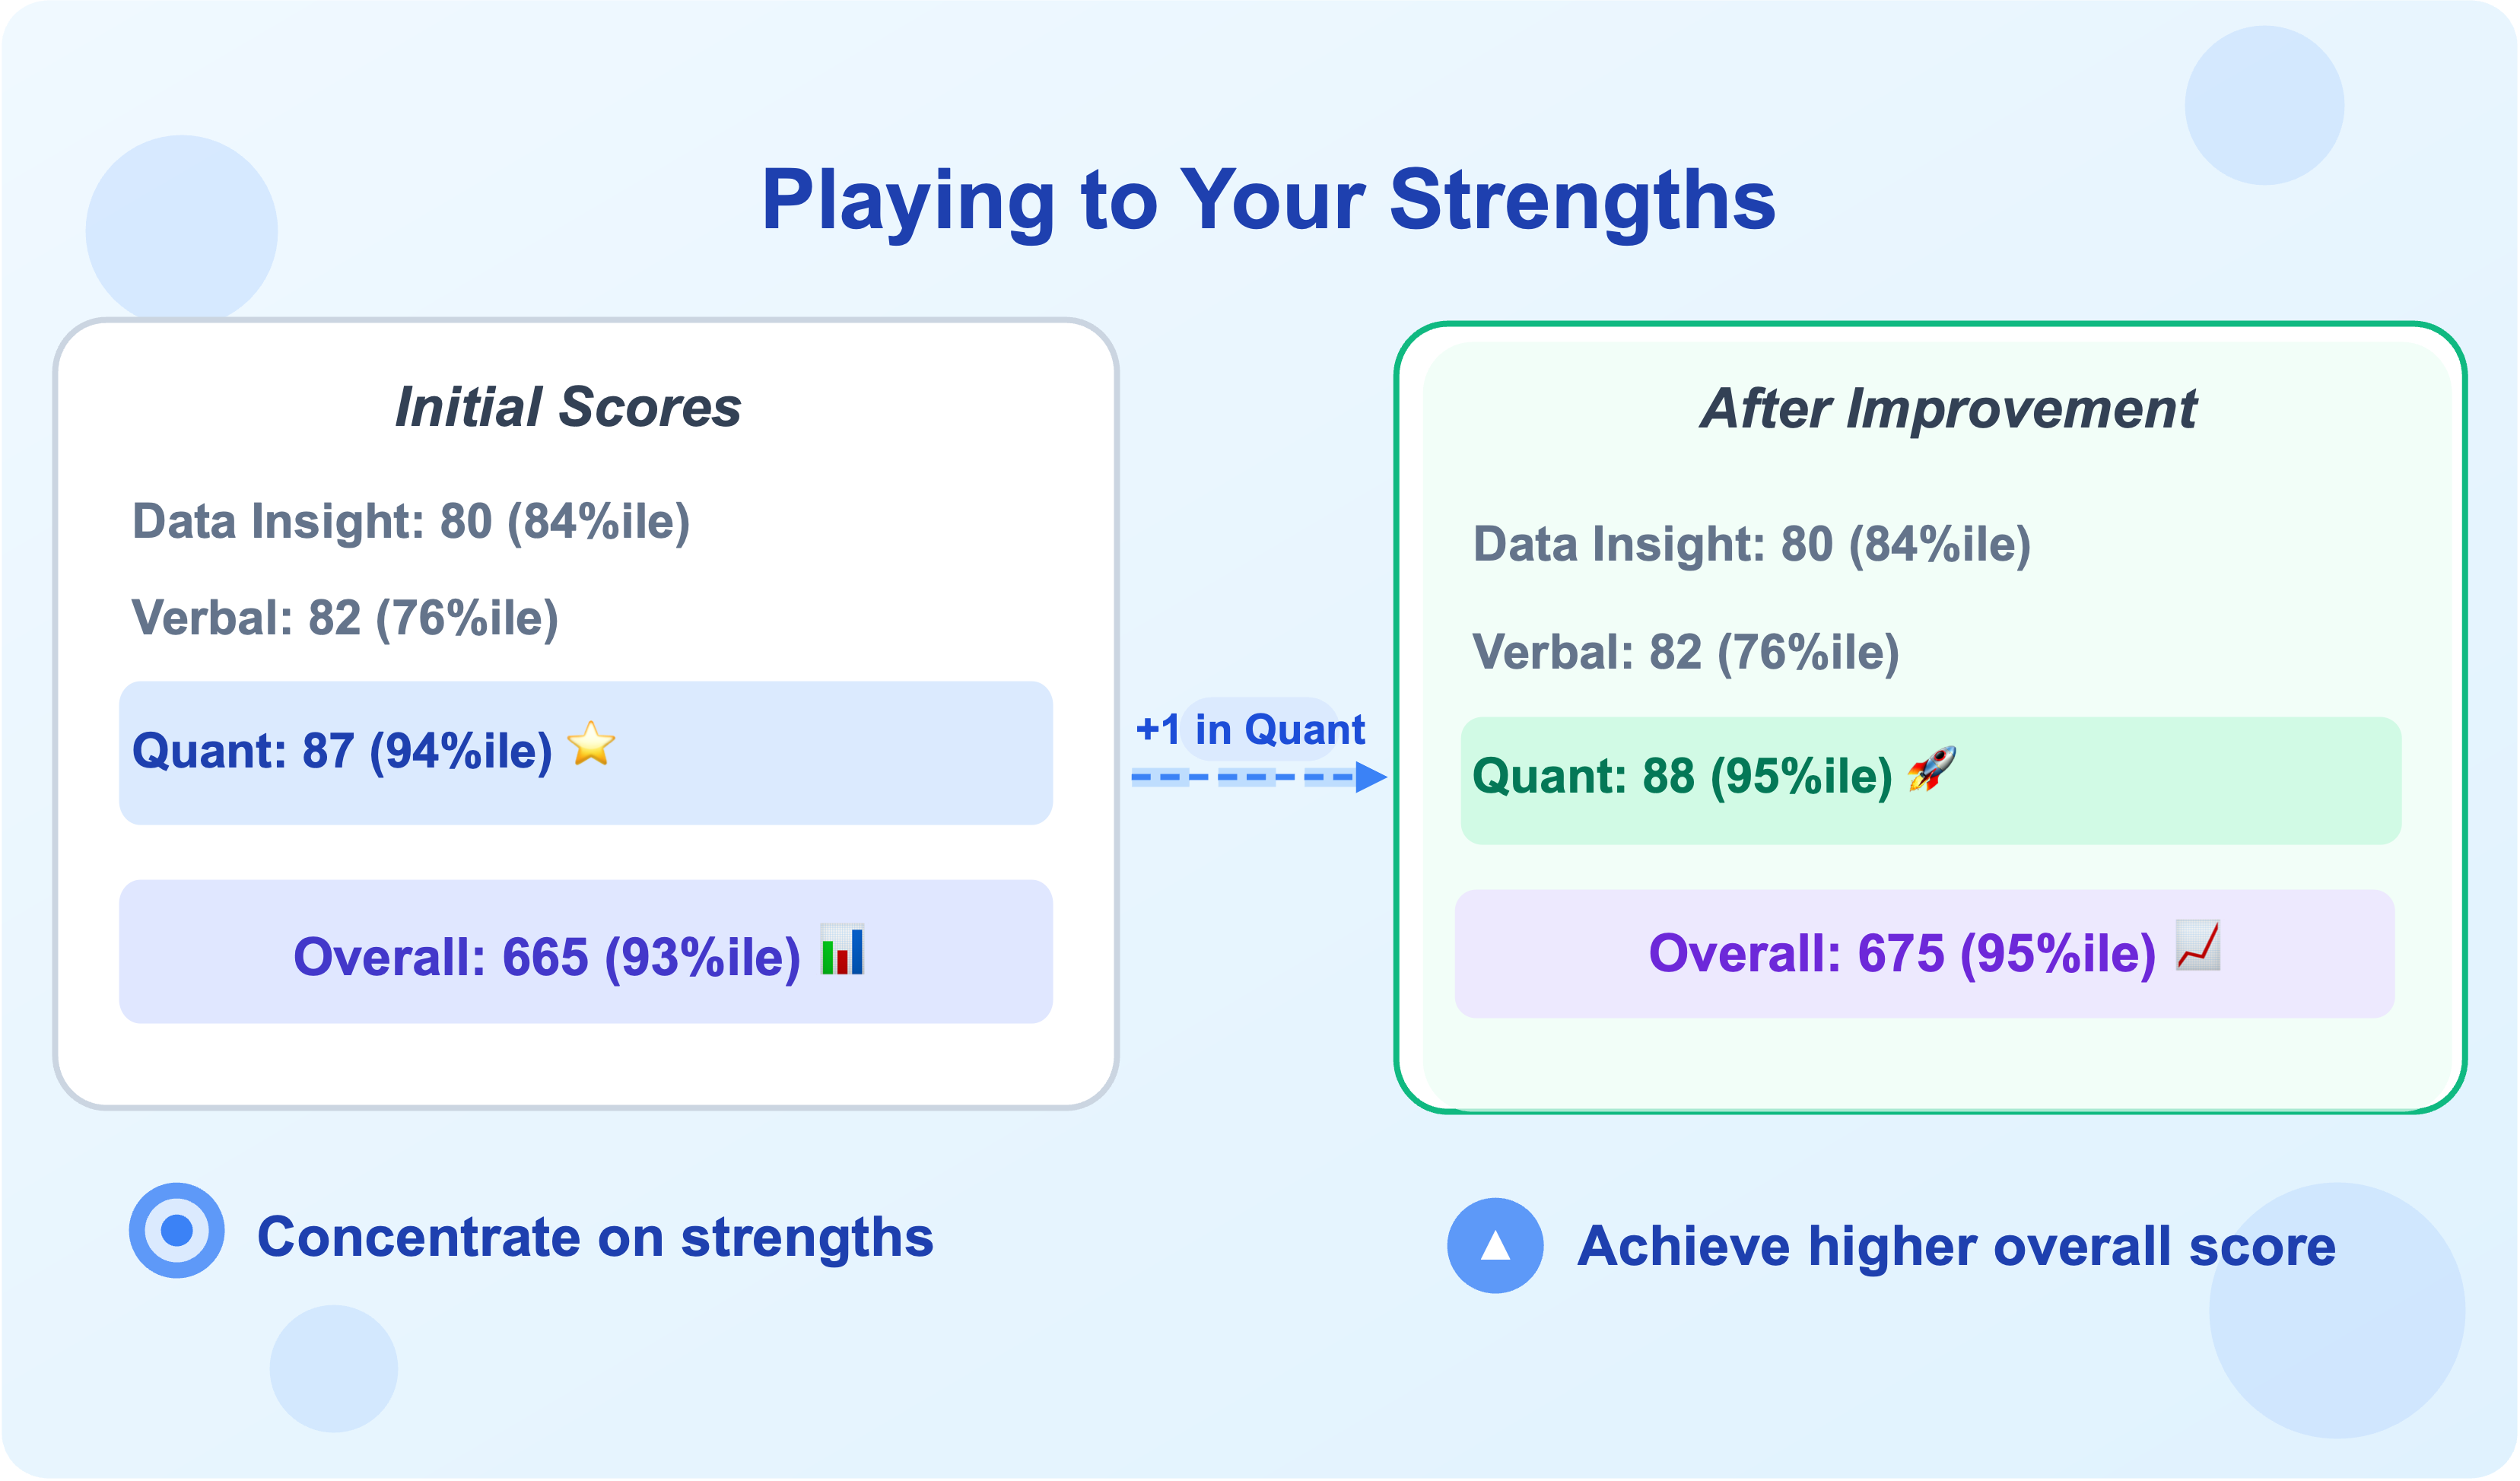
Let me show you a concrete example comparing how this granularity impacts your ability to improve your score on the GMAT versus the GRE:
Lets say these are the current ability levels for a student:
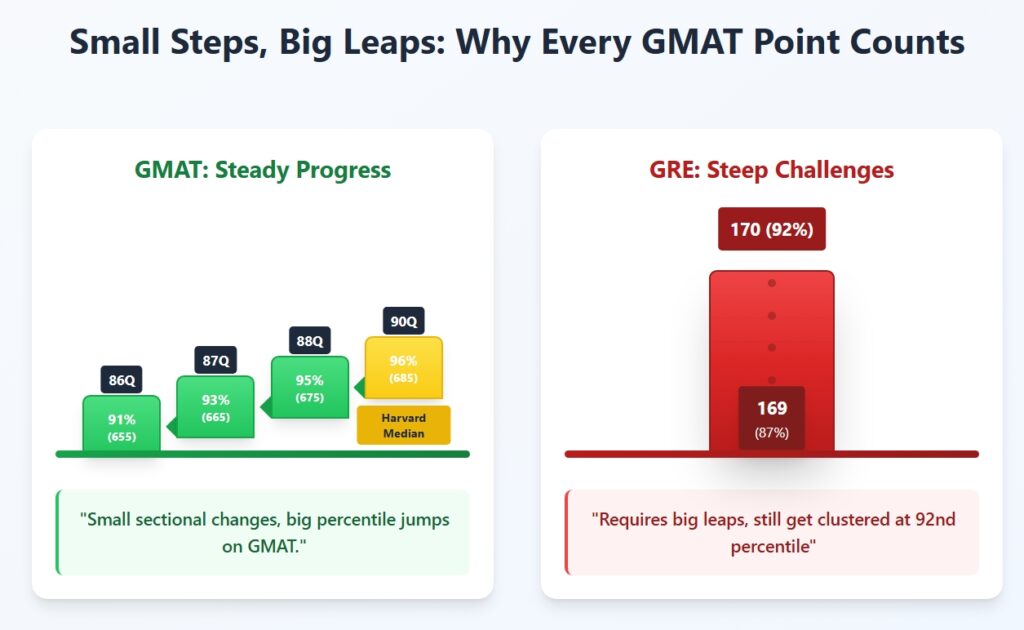
| Exam Section | Absolute Score | Percentile Rank |
| GMAT Quants | 86 | 91st percentile |
| GMAT Overall | 655 | 91st percentile |
Now, the student improves by just 1 point on Quants, from 86 to 87.
You can see the impact of this small improvement on their rank-
| Exam Section | Absolute Score | Percentile Rank |
| GMAT Quants | 87 | 94th percentile |
| GMAT Overall | 665 | 93rd percentile |
Note: To show the impact of finer levels in the Quants section, we assume that the student has maintained the scores for Verbal and DI at the same levels.
Key Takeaways:
- This granularity means a single point improvement translates to a 3 percentile jump on Quants and a 2 percentile jump on overall score
- This shows that every incremental score improvement has a direct and meaningful impact on percentile rank because of the refined granular levels at high scores in GMAT.
- This also means that you DO NOT need to excel in all sections to achieve an exceptional score. If you excel at quantitative problem-solving, the GMAT will reflect this with remarkable precision rather than grouping you with other “good” students. This is particularly valuable if you’re competing against others from similar professional or academic backgrounds.
Want to understand how you can leverage your strengths to ace your GMAT ? Click here.
Let’s now compare the scoring levels for the quant section in GRE.
This table shows the top 5 GRE Quantitative Reasoning scores and their corresponding percentile rankings.
| Scaled Score | Quantitative Reasoning Percentile |
| 170 | 92 |
| 169 | 87 |
| 168 | 83 |
| 167 | 78 |
| 166 | 74 |
Key Takeways:
- The same student who has a ability level of 91st percentile may score 169 on Quant, reflecting only an 87th percentile rank.
- For any improvement in their quant score, the student needs to make a direct jump of 5 percentiles by achieving a perfect 170 which requires significant effort for them.
- Further, even when they achieve this perfect score, their percentile stands at only 92 in Quants which does not reflect the true ability level for the student.
- This improvement only shows a 1-point increase in the overall score, with no information about how it affects your ranking compared to others, since GRE doesn’t provide percentile rankings for total scores.
This finer granularity on the GMAT allows you to make measurable progress through targeted study rather than requiring perfect performance to see any meaningful change in your percentile ranking.
Verbal Reasoning
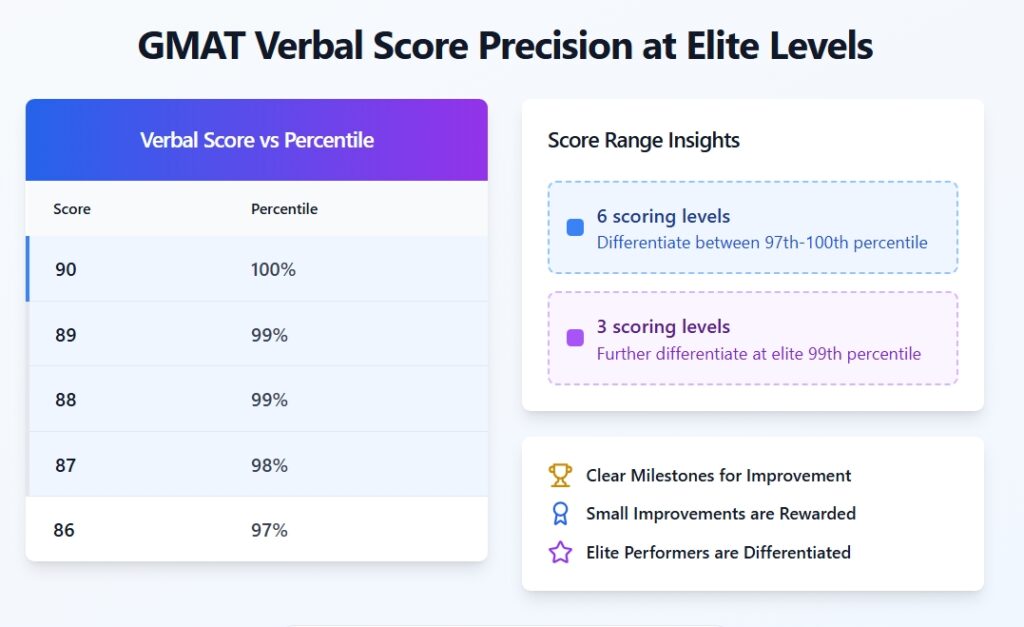
The GMAT Verbal section demonstrates an even finer granularity at higher score ranges:
- At scores 86-90, each single point improvement corresponds to a meaningful percentile increase
- A score of 85 places you at the 94th percentile, while 86 elevates you to the 97th percentile
- Even at the very top range, the distinction between 88, 89 (99th percentile) and 90 (100th percentile) is captured
Data Insights
What’s particularly valuable is that the Data Insights section offers the highest level of differentiation at top percentiles:
- Scores of 83, 84, and 85 correspond to the 95th, 97th, and 98th percentiles respectively
- Each single-point improvement at the 80+ score level translates to a 1-2 percentile increase
- Even at the 88-90 score range, the test distinguishes between 99th and 100th percentile performers
This fine granularity benefits students by:
- Providing clear, achievable milestones for improvement
- Allowing small improvements in verbal skills to be recognized and rewarded
- Giving admissions committees the ability to distinguish between candidates with excellent verbal abilitie
In highly competitive programs where many applicants have strong overall scores, this granularity allows students to stand out even within the top tier. The difference between 96th and 99th percentile could separate candidates in elite applicant pools.
How Does the GMAT Scoring System Benefit Applicants: Strategic Implications
1. Enhanced Scholarship Opportunities

The GMAT’s finer scoring granularity can directly impact scholarship decisions at top business schools.
Many prestigious MBA programs utilize specific score thresholds when allocating their merit-based scholarships, with incremental funding increases tied to score bands.
The granular scoring system of GMAT allows admissions committees to make finer distinctions between similarly qualified candidates who might otherwise appear equivalent.
How?
Because GMAT allocate a different percentile at each 10-point increments. Hence, increasing your GMAT score by just 10-20 points can potentially translate to tens of thousands of dollars in additional scholarship funding, especially at top-tier programs where competition for financial support is intense.
For example, a candidate with a 695 GMAT score (approximately 98th percentile) may qualify for a higher scholarship tier than someone with a 685 (approximately 96th percentile) at many top 20 business schools, despite the relatively small difference in actual ability.
2. More Forgiving Error Penalties
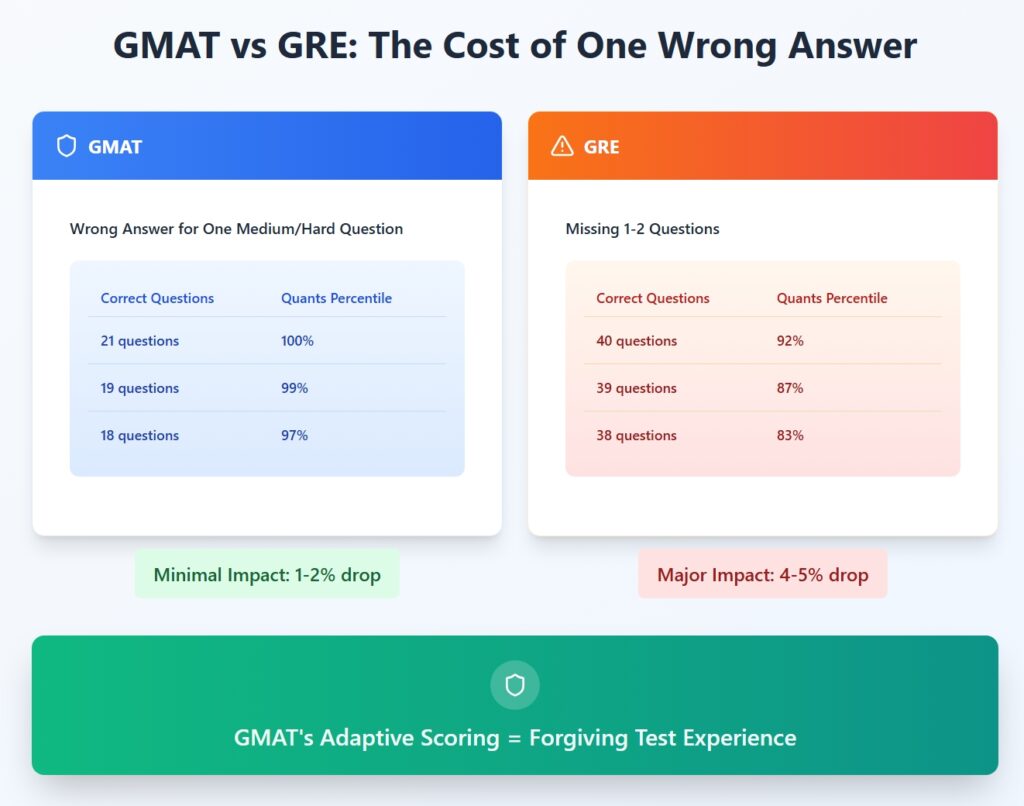
The GMAT’s granular scoring system creates a more forgiving test experience compared to exams with coarser scales.
Let me explain this with an example:
On the GMAT:
- If you score 88 in Quant, you’re at the 95th percentile
- If you answer one medium-difficulty or hard-difficulty question incorrectly, it may drop you to an 87 or 86
- This mistake would lead you to a 94th percentile (just a 1 percentile point drop) or a 91st percentile from the 95th percentile
Compare this to the GRE:
- If you score a 170 in Quant, you’re at the 92nd percentile
- Since the GRE scoring is more step-function-like than continuously variable, missing 1-2 questions on the GRE Quant section would typically drop your score from 170 to 169/168
- These small mistakes can place you at the 87th or a 83rd percentile (a 5-9 percentile point drop at least)
This difference is critical for high-performing test-takers. On the GMAT, minor errors result in proportionally minor penalties to your percentile ranking. On the GRE, because there are only 5 possible score levels between 166-170, each question carries more weight in your final percentile. Hence, the small errors can dramatically affect your percentile standing because of the coarser scale with fewer distinct score levels at the high end.
If you’re targeting top programs where the median score is in the 90th+ percentile range, a bad day or a few careless errors on the GRE could drop you below the competitive threshold. With the GMAT, the same minor errors would likely keep you within the competitive range due to the more forgiving, granular scoring system.
This means the GMAT gives a more accurate representation of your true abilities by not heavily penalizing occasional mistakes, while the GRE’s scoring can exaggerate the impact of those same errors.
3. Overall Percentile Advantage vs. Sectional Requirements

The GMAT’s reporting of an overall percentile offers a significant strategic advantage over the GRE, which reports section scores separately.
Let me illustrate this critical difference using our previous example:
For GMAT applicants to Harvard Business School (median score 685):
- A candidate with exceptional verbal skills (89 in Verbal – 99th percentile) but moderate quantitative and DI abilities (83 in Quant – 81st percentile and 80 in DI – 84th percentile) can still achieve Harvard’s target overall score by leveraging their verbal strength
- Their combined sectional performance would yield an overall score around 685 (96th percentile), making them competitive despite having uneven sectional performance
For GRE applicants to the same school:
- Harvard typically expects both Verbal and Quantitative scores at 163 each
- Even if a candidate scores perfectly on Verbal (170 – 99th percentile), they must still reach the threshold in Quant
- A candidate with the same skill distribution as our GMAT example (exceptional verbal, moderate quant) might be disadvantaged despite having the same overall cognitive abilities
This fundamental difference creates a strategic opportunity for GMAT test-takers. If you have an uneven skill profile—perhaps you’re a humanities major with excellent verbal reasoning but moderate quantitative skills, or an engineer with exceptional quantitative abilities but moderate verbal skills—the GMAT allows you to capitalize on your strengths while maintaining adequate performance in weaker areas.
The GRE’s separate sectional requirements create a higher hurdle, as you must meet minimum thresholds in both sections independently, regardless of exceptional performance in one area.
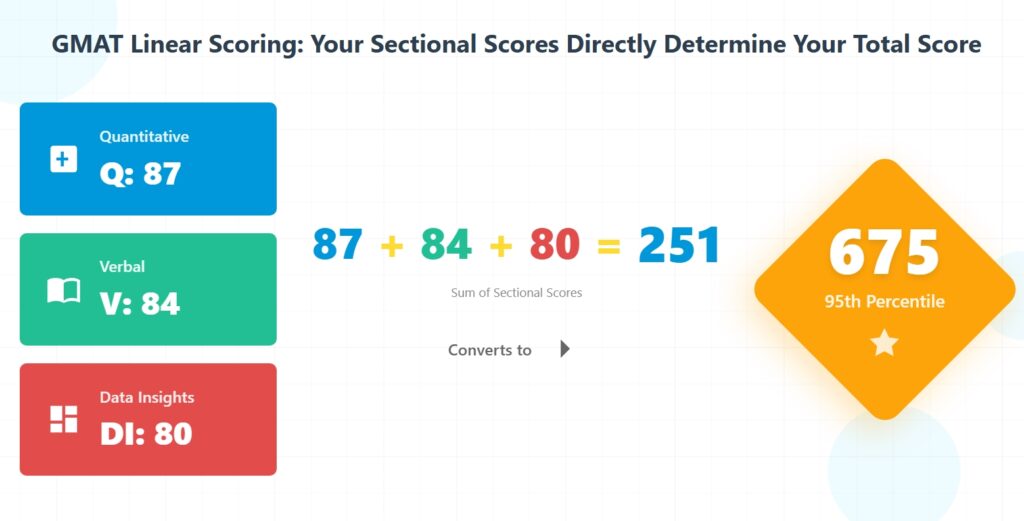
4. Strategic Section Focus: Playing to Your Strengths
The GMAT’s scoring system rewards strategic specialization:
Let’s say your target GMAT score is a 675 (95th percentile) and your strength is Quants.
Here is how you can target sectional scores playing on your strength:
| Section | Score | Percentile |
| Quants | 88 | 95 |
| Verbal | 82 | 76 |
| DI | 80 | 84 |
| Overall | 675 | 95 |
You can score a 95th percentile on GMAT by scoring a 95th percentile on Quants, which is your strength, while maintaining a decent performance in the other two section (84th and 76th percentile in DI and Verbal).
This strategic flexibility allows candidates to:
- Concentrate preparation efforts on their strongest areas
- Maintain adequate performance in weaker sections
- Achieve an impressive overall score that highlights their exceptional abilities
Want to know how you can achieve your target GMAT score by capitalizing on your strengths? Read the detailed strategy here.
Key Benefits of GMAT Scoring for Different Stakeholders
| Stakeholder | Benefits of Higher Scoring Granularity |
| MBA Applicants | ✅ Enhanced Score Differentiation: 10 scoring levels between the 99th-100th percentile range allows exceptional candidates to stand out ✅ Strategic Section Focus: Leverage your strengths in specific sections to achieve higher overall scores ✅ Scholarship Opportunities: Even small score improvements (10-20 points) can potentially translate to thousands in additional scholarship funding ✅ Forgiving Error Penalties: Missing questions results in proportionally small penalties compared to less granular tests |
| Business Schools | ✅ Superior Candidate Assessment: Exceptional scoring granularity particularly at 90th-100th percentile levels ✅ Precise Differentiation: Ability to distinguish between top candidates (e.g., 725, 705, and 685 representing 99th, 98th, and 96th percentiles) ✅ Refined Merit-Based Aid Decisions: More data points for allocating scholarship funds based on precise performance levels ✅ Reduced Score Clustering: Less likelihood of many candidates having identical scores at competitive ranges |
| Employers | ✅ Refined Talent Assessment: More meaningful signals about candidates’ cognitive abilities ✅ Skill Distribution Insights: Better understanding of candidates’ strengths across different reasoning domains ✅ Talent Identification: Improved ability to identify exceptional analytical and verbal reasoning capabilities ✅ Performance Prediction: More granular data points for predicting on-the-job performance |
How is the GMAT Total Score Calculated?
The GMAT uses a straightforward linear scoring system that directly links your sectional performance to your overall score. Here’s how it works:
- Sum of Sectional Scores: Your overall GMAT score (205-805) is determined by adding your three sectional scores—Quantitative Reasoning, Verbal Reasoning, and Data Insights—each scored on a scale of 60-90.
- Perfect Predictability: The relationship is completely linear and consistent for all test-takers. For example:
A sum of 246 always translates to approximately 645
A sum of 250 always results in approximately 675
A sum of 255 always yields approximately 705
- Equal Section Weighting: Each section contributes equally to your total score. This means a 1-point increase in any section (Quant, Verbal, or Data Insights) will have the identical impact on your overall score.
- Conversion Rate: For every 1.5-point increase in your sum of sectional scores, your overall GMAT score increases by approximately 10 points. This predictable relationship makes it easier to set strategic targets for each section.
- Independent Sections: Your performance in one section doesn’t affect the scoring in other sections. This allows you to leverage your strengths strategically while ensuring adequate performance across all areas.
This linear structure means you can work backward from your target GMAT score to determine exactly what sectional scores you need, creating a customized GMAT study plan that plays to your strengths.
The scoring architecture creates a transparent system where you can clearly see how improvements in any section will impact your final score, allowing for strategic preparation that targets your strengths and optimizes your study plan accordingly.
GMAT Study Plan Based on Score Goals
Targeting your desired GMAT Focus score requires understanding the “sum of scores” framework, where your result (out of 805) depends equally on your performance across Quant, Verbal, and Data Insights (each scored out of 90). Your most effective GMAT study plan is to identify your strengths and allocate your preparation time to maximize scores in those sections while ensuring adequate performance in others.
Let’s understand the same through examples:
Example 1: A target GMAT Score of 645 (88th percentile)
If you’re targeting ISB, you’ll need a GMAT Focus score of 645 (their median). This requires a sum of sectional scores of 246. To be on the safer side, we recommend aiming for 247. To achieve this score, you need to be fairly good (90+ percentile) in at least one section.
Say you’re like Student A, with Quant as your stronger section.
| Section | Target Score | Percentile | Rationale |
| Quant | 86 | 91st | Leverage strength to maximize contribution |
| Verbal | 82 | 76th | Maintain competitive performance without overextending |
| Data Insights | 78 | 70th | Focus on core DI skills while prioritizing Quant/Verbal |
Student A leverages their Quant strength by targeting an impressive 86 (91st percentile) in this section, making it a major contributor to their overall score. By focusing on his quantitative strength, he can set more modest goals for the Verbal and Data Insights sections, targeting the 79th and 73rd percentiles respectively. This approach helps him maintain a strong overall score without the pressure to excel in his weaker areas. The strategy effectively leverages his strengths while ensuring he meets his comprehensive target.
If you’re like Student B, with Verbal as your stronger section.
| Section | Target Score | Percentile | Rationale |
| Verbal | 85 | 94th | Capitalize on reading comprehension and CR strengths |
| Quant | 82 | 76th | Focus on foundational concepts |
| Data Insights | 79 | 77th | Balance DI preparation with verbal focus |
Student B capitalizes on their Verbal strengths by aiming for 85 (94th percentile) in this section, while maintaining decent performance in Quant (82/76th percentile) and Data Insights (79/77th percentile) for a balanced approach to reaching their target score.
This way, the students ensure they still maintain a high overall score without the pressure of having to overperform in areas that are not their strengths.
Example 2: A target GMAT Score of 685 (96th percentile)
If you’re targeting M7 schools, you’ll need a GMAT Focus score of 685. This requires a sum of sectional scores of 252. To achieve this score, you need to be strong (95+ percentile) in one section and fairly good (90+ percentile) in another section.
Say you’re like Student A, with Quant as your stronger section.
| Section | Target Score | Percentile | Rationale |
| Quant | 88 | 95th | Master hard-level questions (80%+ accuracy) |
| Verbal | 84 | 90th | Advanced techniques for Verbal (90% medium-hard) |
| Data Insights | 80 | 84th | 90% accuracy in medium level questions |
Student A leverages their Quant strength by targeting an impressive 88 (95th percentile) in this section, making it a major contributor to their overall score. They aim for slightly lower yet competitive targets in Verbal (84, 90st percentile) and DI (80, 84th percentile).
If you’re like Student B, with Verbal as your stronger section.
| Section | Target Score | Percentile | Rationale |
| Verbal | 86 | 97th | 80% accuracy in hard questions, cementing your strengths |
| Quant | 86 | 91st | 90% accuracy in medium hard questions. |
| Data Insights | 80 | 84th | Slightly lower but competitive target |
Student B capitalizes on their Verbal strengths by aiming for 86 (96th percentile) in this section, while maintaining solid performance in Quant (86/91st percentile) and Data Insights (80/86th percentile) for a balanced approach to reaching their target score.
Example 3: A target GMAT Score of 705 (98th percentile)
If you’re targeting scholarship-level scores, you’ll need a GMAT Focus score of 705. This requires a sum of sectional scores of 255. To achieve this score, you need to be strong (95+ percentile) in two sections and fairly good (90+ percentile) in the remaining section.
| Section | Target Score | Percentile | Rationale |
| Quant | 88 | 95th | Impressive Target bolstering the score |
| Verbal | 86 | 97th | 80% accuracy in hard questions |
| Data Insights | 81 | 89th | Balanced solid target. |
Conclusion
Understanding the sophisticated architecture of GMAT scoring provides a strategic advantage in your MBA application journey. The GMAT Focus Edition offers unparalleled scoring precision with 2.5X more granularity than competitors at higher ranges, creating meaningful distinctions between candidates. By using our GMAT score calculator, you can determine exactly where you stand and develop a customized study plan that optimizes your performance based on your unique strengths and goals.
The key takeaways from our deep dive include:
- The linear scoring system allows you to strategically leverage your strengths across the equally-weighted Quant, Verbal, and Data Insights sections
- Superior scoring granularity, particularly in the 90th-100th percentile range, helps you stand out in competitive applicant pools
- Strategic section specialization can yield impressive overall scores even with moderate performance in your weaker areas
- The predictable “sum of sectional scores” framework enables precise targeting of your desired outcome
- Even small score improvements can translate to significant scholarship opportunities
By understanding how each section contributes to your overall score, you can develop a customized study plan that optimizes your performance based on your unique strengths and goals. Whether you’re targeting ISB’s 645 median or aiming for a scholarship-worthy 705, the GMAT score calculator and strategies outlined here provide a roadmap to achieve your target score efficiently.
Ready to tackle the GMAT Focus Edition? e-GMAT offers a Personalized Study Planner and top-notch Free GFE mock exam to help you prepare effectively. As the most reviewed GMAT prep company on GMAT Club with 2800+ reviews we’re here to support your GFE journey. Take advantage of our free trial with the best quality content. Start your path to success today!
FAQs
The GMAT Score Calculator helps you determine the percentile ranking of your total GMAT score and sectional scores. Simply input your total score and sectional scores to see where your GMAT percentile and sectional percentiles. The calculator is based on comprehensive data from 2019-2024 with a sample size of 596,155 test-takers.
A good GMAT score in 2025 depends on your target business schools, but generally, 645+ (88th percentile) is competitive for many programs, 685+ (96th percentile) for top-tier schools, and 705+ (98th percentile) for elite programs or scholarship consideration.
The article provides strategic section score combinations in the examples to reach each of these target scores based on your individual strengths.
A 700 on the GMAT Focus Edition corresponds to the 98th percentile, meaning you’ve scored higher than 98% of test-takers. This places you among the top 2% of all GMAT test-takers based on the 2019-2024 data with a sample size of 596,155 test-takers.
According to the score chart provided in the GMAT Score Chart: Total Score and Percentile section, scores between 695 and 705 both fall within the 98th percentile range. This high percentile ranking makes a 700 GMAT score very competitive for admission to top business schools, including M7 programs as explained in the Strategic Implications section.
GMAT percentiles change based on the performance of the test-taking population over time. The percentile rankings in this guide are based on data from 2019-2024 with a sample size of 596,155 test-takers.
When the overall performance of test-takers improves, the same absolute score might correspond to a lower percentile. Conversely, if fewer people achieve high scores, your same score could represent a higher percentile. GMAC periodically updates these percentiles to reflect the current test-taking population, which is why it’s important to refer to the most recent data when evaluating your GMAT performance.
The highest possible GMAT Focus Edition score is 805, which represents the 100th percentile. Scores between 735-805 all fall within the 100th percentile, offering 8 distinct scoring levels at this top percentile.
As detailed in the Score Granularity at High Percentile Levels section, the GMAT Focus Edition demonstrates exceptional scoring granularity, with multiple distinct scores in the top percentile ranges.
To improve your GMAT section scores, identify your strengths and focus your preparation strategically. For your strongest section, aim to master hard-level questions (80%+ accuracy), while maintaining solid performance in other sections.
As outlined above, if Quant is your strength, target an impressive score like 88 (95th percentile) by mastering hard-level questions. For Verbal, aim for advanced techniques with 90% accuracy on medium-hard questions. For Data Insights, focus on achieving 90% accuracy in medium-level questions. The Examples suggest that by leveraging your strengths in this way, you can achieve high overall scores without needing to excel equally in all three sections.
The GMAT Focus Edition offers 2.5X more scoring precision than the GRE at higher score ranges. While the GRE reports section scores separately with limited granularity, the GMAT provides an overall score with exceptional differentiation at high percentile levels.
Key differences include:
The GMAT delivers finer granularity at the top percentiles
The GMAT’s error penalties are more forgiving
The GMAT reports an overall percentile that allows leveraging strengths in one section, while GRE candidates need to meet minimum thresholds in both sections separately as explained in the Overall Percentile Advantage section
Yes, the GMAT’s scoring system allows you to leverage your strengths in one section to compensate for weaker performance in others.
As demonstrated in the Strategic Section Focus section, you can score in the 98th percentile overall (~685 score) by excelling in your strongest area (95th percentile) while maintaining decent scores in other sections (85th and 90th percentiles). This approach allows you to concentrate preparation efforts on your strongest areas, maintain adequate performance in weaker sections, and achieve an impressive overall score that highlights your exceptional abilities.
Business schools use GMAT percentiles to compare candidates effectively and make meaningful distinctions between applicants with different ability levels. The GMAT’s exceptional granularity allows schools to distinguish between truly exceptional (99th percentile), excellent (98th percentile), and very strong (96th percentile) candidates.
As explained in the Why Scoring Granularity Matters section, Harvard Business School, with a median GMAT score of 685 (96th percentile), can use the test’s granularity to identify candidates with specific strengths.
Yes, small GMAT score differences can significantly impact scholarship decisions. What might seem like a modest difference of just 10-20 GMAT points can potentially translate to tens of thousands of dollars in additional scholarship funding.
Many prestigious MBA programs utilize specific GMAT score thresholds when allocating their merit-based scholarships, with incremental funding increases tied to score bands. For example, a candidate with a 695 GMAT score (98th percentile) may qualify for a higher scholarship tier than someone with a 685 (96th percentile) at many top-20 business schools, despite the relatively small difference in actual ability. This is especially important at top-tier programs where competition for financial support is intense.