Question
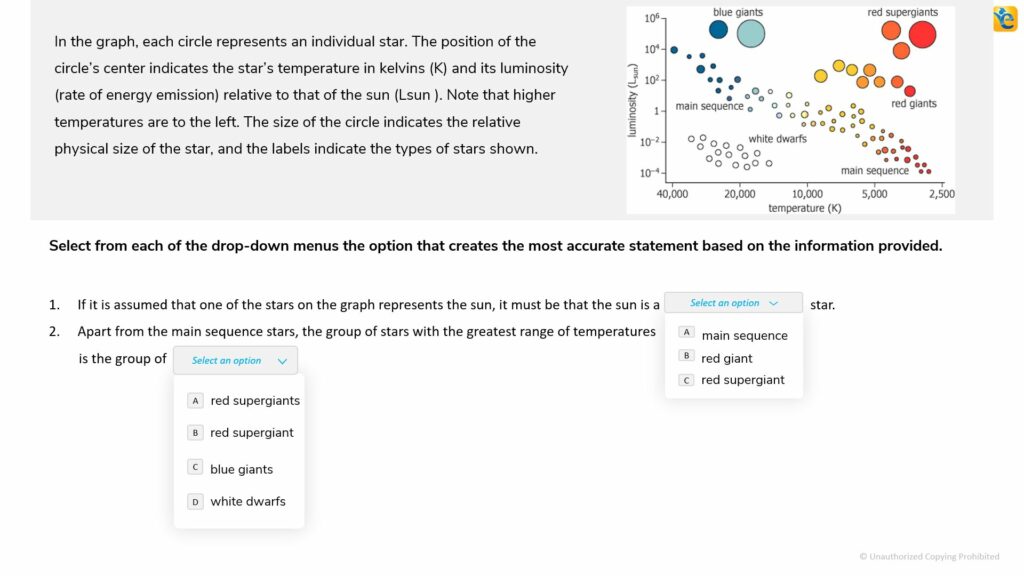
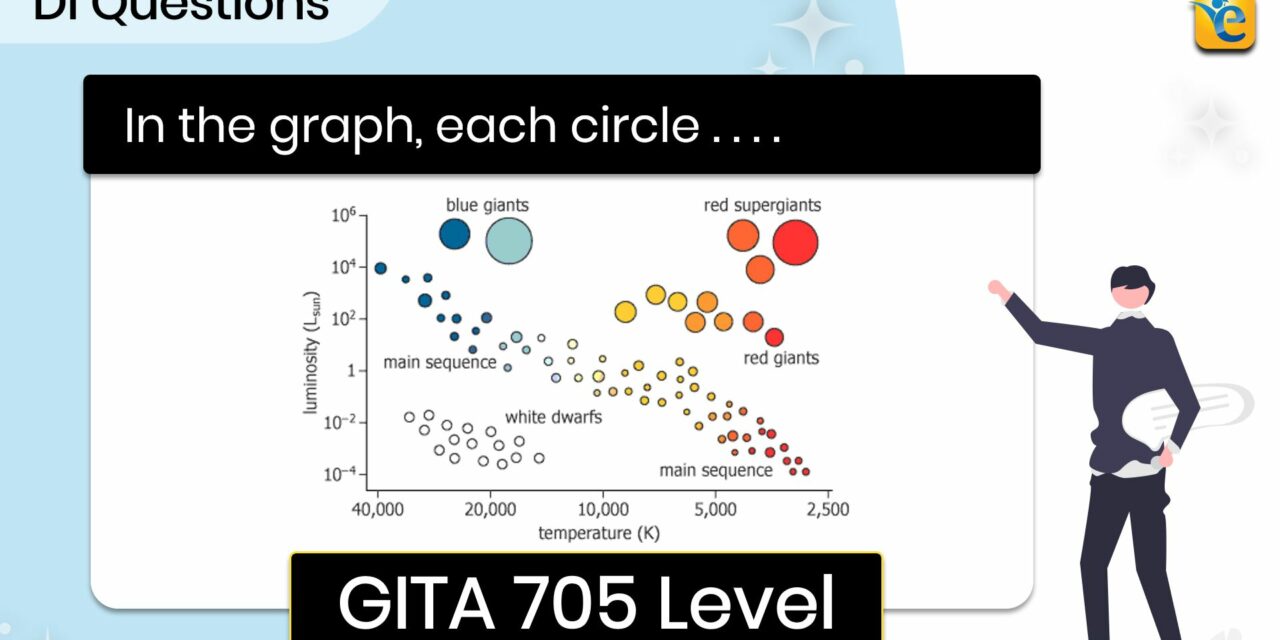
In the graph, each circle represents an individual star. The position of the circle’s center indicates the star’s temperature in kelvins (K) and its luminosity (rate of energy emission) relative to that of the sun (Lsun)…..

Solution – In the graph, each circle represents an individual . . . .
To watch the video solution to see “owning the dataset” approach come to life on this question.
Question Attributes
- Source: Official Guide 2023-24
- Difficulty Level: Hard – 61% accuracy
- Question Type: Graphics Interpretation
- Category: Non-Math
Helpful Links
Dive deeper into our GMAT preparation strategies and access a wealth of resources by signing up for a free trial. Click the link below to start your journey to GMAT success with e-GMAT.
- Free Trial Access
- Free GMAT Focus Mock Test
- DI Video Solutions Playlist
- GFE Success Stories
- GMAT Study Plan
Summary – In the graph, each circle represents an individual . . .
To master DI questions, apply the “owning the dataset” approach that entails the following three steps:
- Thoroughly understand the dataset by actively translating, drawing inferences, and visualizing information.
- Determine the approach to solve the question asked.
- Execute the approach.
Ready to tackle the GMAT Focus Edition? e-GMAT offers a Personalized Study Planner and top-notch Free GFE mock exam to help you prepare effectively. As the most reviewed GMAT prep company on GMAT Club with 2700+ reviews we’re here to support your GFE journey. Take advantage of our free trial with the best quality content. Start your path to success today!


