Solving GMAT Math questions become easier if you are able to visualize the information in the form of a diagram. One of the most efficient ways to do so is through a Venn diagram. A Venn diagram helps you to organize information visually so that it becomes easier to understand the relationship between two or three sets of items. Since you need to solve GMAT Math questions as quickly as possible, using Venn diagrams becomes even more important. In this article, we’ll look at how to use two-set and three-set Venn diagrams to quickly solve GMAT Math problems.
Here is the outline of the article:
- Objective of this article
- Agenda of the Article
- Solving GMAT Math using Two-Set Venn Diagram
- Solving GMAT Math using Three-Set Venn Diagram
- Key takeaways – How to solve GMAT Math using Venn Diagrams

Objective of this article
- The primary objective of this article is to explain the use of Visualizing the information given in a question and representing it in the form of a Venn Diagram.
- This article is helpful for those who have a basic understanding of Sets and Elements.
- After going through the article, one will be able to solve various questions on Sets, simply by representing the information in a Venn Diagram.
Agenda of the Article
- In this article, first, we will see how to understand a two set and a three-set Venn diagram.
- Then, we will solve 1 example to learn how to represent the given information in a two-set Venn Diagram
- And, we will also solve 1 more example to understand how we can solve the questions related to three-set Venn diagram.
So, let us start learning.
Solving GMAT Math using Two-Set Venn Diagram
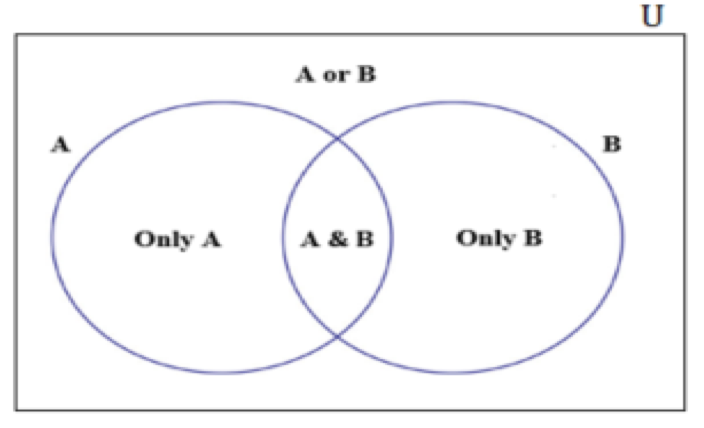
Let us understand each entity in the above diagram by considering a sample scenario.
Scenario
In a basket, there are a certain number of apples and oranges. These must be divided among 10 people according to their preferences.
- Among the 10 people, 8 people eat apples, 5 eat oranges and 3 eat both.
Venn-Diagram representation of the scenario:
Now, let us try to draw a Venn diagram for this scenario.
- The first step is to identify the different sets. In this scenario, we may think that there are two sets of people
- One who eats apples and,
- The other who eats oranges
- If we sum up the two sets, the number of people, who eat apples and the number of people who eat oranges, we get 8 + 5 = 13.
Now, most of you might wonder why this number is greater than the actual total number of people, that is 10.
- Well, the answer is quite simple, we are counting a few duplicates while we are summing up the two sets.
- Out of the 8 people, who eat apples, there are few people who eat oranges as well, which is the intersection of both the sets.
- And, similarly, among the 5 people, who eat oranges, few of them eat apples as well.
- Thus, while we are adding the two pieces, we are counting the intersection part twice. So, we need to subtract it once to get the total number of people.
Therefore, the total number of people = the number of people who eat apples + the number of people who eat apples – the number of people who eat both
- n (A or B) = n(A) + n(B) – n (A & B)
Now, if you see the Venn diagram, there is a rectangular box around the two sets. You might wonder what it is. So, let’s see the significance of the rectangular box
- Suppose, in this previous scenario, if there were 12 people in total instead of 10, then we cannot account space for the remaining two in the circles.
- This implies they belong to the region outside the circle.
- That is, these two people do not eat either of the fruits.
- For our convenience, we will denote this number of people by D.
- So, the rectangular region is the sum of the people who eat at least one fruit and the people who do not eat either = 10 + 2 = 12
- This rectangular box around the two sets is called the universal set, U.
- A or B is a subset of the universal set.
- If all the elements of the universal set are in either A or B, then n (A or B) = n (U), else, n (U) = n (A or B) + n (D)
Now, let us apply this learning to solve a simple example.
If you are planning to take the GMAT, we can help you with a personalized study plan and give you access to quality online content to prepare. Write to us at acethegmat@e-gmat.com. We are the most reviewed GMAT prep company on gmatclub with more than 1800 reviews (as on Feb 20, 2019). Why don’t you take a free trial and judge it for yourself?
GMAT Math – Example-1
All the 400 people, who were surveyed, used either Phone A or Phone B or both. 75% of them said that they used Phone A, and 36% of these people said that they used both the Phones. How many of the surveyed people used Phone B?
- 100
- 144
- 208
- 244
- 256
Understanding the question
Let us first identify the different sets mentioned in this question,
- The universal set is the 400 people, who were surveyed.
- Among them,
- Set 1 is the people who used phone A, and
- Set 2 is the people who used phone B
Now that we have identified the sets mentioned, let’s understand the information given about them.
- We are told that 75% of the people, who were surveyed, use phone A.
- And among them, 36% of the people also use phone B. This is the intersection part of both the sets
Draw the Venn Diagram
Now that we have understood all the information that is given to us, let’s represent this information in a two-set Venn-diagram.
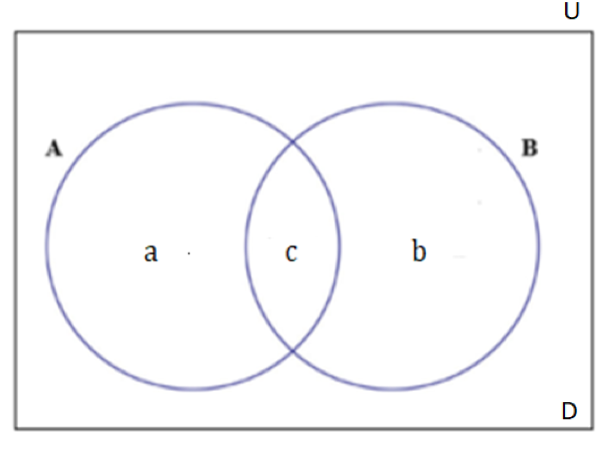
Let’s find the value of each entity in the Venn diagram using the information given to us
- Since, all the 400 people used at least one phone between A and B, we can say that D = 0.
- Or, the number of people who did not use any phone out of A and B = 0
- Thus, n (U) = n (A or B) = a + b + c = 400 …. (1)
- We are given that, n (A) = a + c = 75% of 400 = 300, and …. (2)
- n (A & B) = c = 36% of n (A) = 36% of 300 = 108 …. (3)
- And we are asked to find the number of people, who used phone B, which is n (B) = b + c
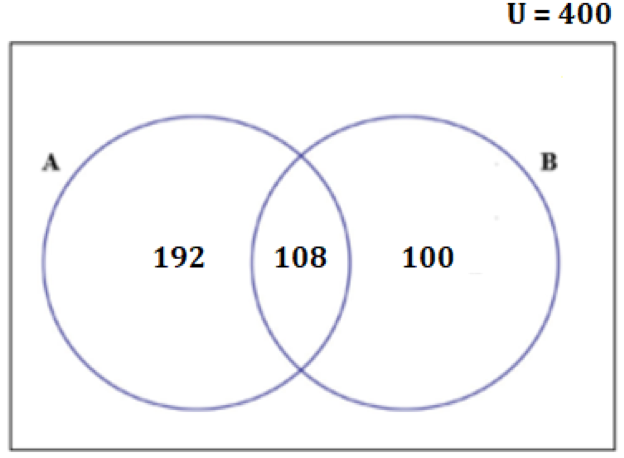
From equations (1) and (2), we get
- b + (a + c) = 400
- Implies, b = 100
- Thus, b + c = 100 + 108 = 208
Hence, the number of people, who used phone B = 208
Now that we are well versed with two-set Venn diagram applications, let’s see how to apply the same in a three-set Venn-diagram
Solving GMAT Math using Three-Set Venn Diagram
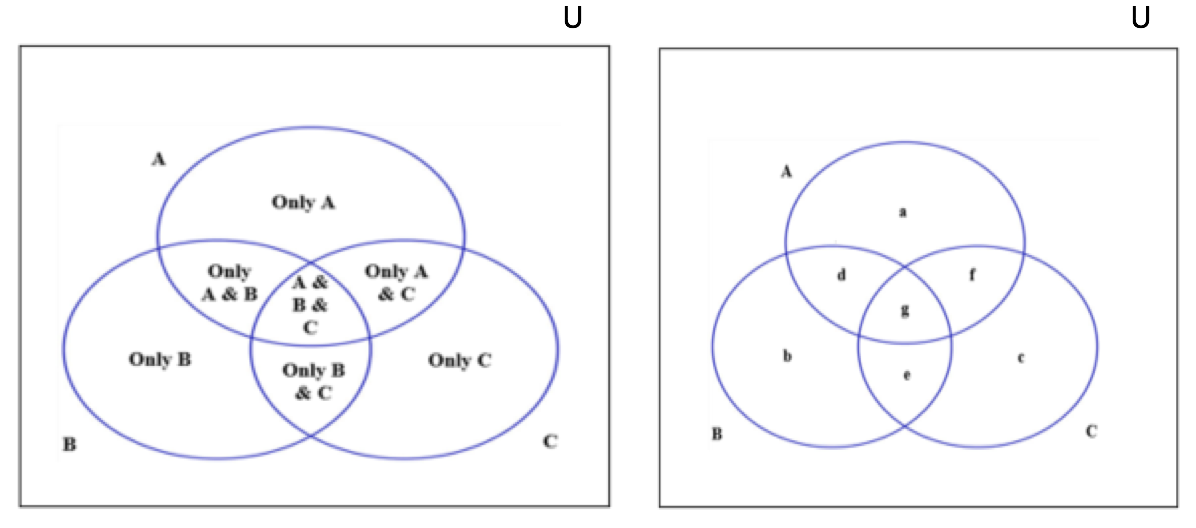
Let us understand each entity in the above diagram by considering the same scenario with one more set.
Scenario
In a basket, there are a certain number of apples, oranges, and grapes. These must be divided among 10 people according to their preferences.
- Among the 10 people,
- 8 people eat apples, 5 eat oranges, 7 eat grapes,
- 3 eat both apples and oranges, 4 eat both oranges and grapes, 5 eat both grapes and apples,
- And 2 people eat all three.
Venn-Diagram representation of the scenario
Now, let us try to draw a Venn diagram for this scenario.
- The first step is to identify the different sets. In this scenario, there are three sets of people:
- People who eat apples,
- People who eat oranges, and
- People who eat grapes
- If we sum up the three sets, the number of people, who eat apples, the number of people who eat oranges and the number of people who eat grapes, we get, 8 + 5 + 7 = 20.
If we observe, this number is greater than the actual total number of people, that is 10.
- Well, similar to the two-set case, we are counting a few duplicates while we are summing up the three sets.
- Out of the 8 people who eat apples, there are few people who eat oranges and few people who eat grapes, which are represented by the intersection parts.
- Similarly, among the 5 people who eat oranges, there are few people who eat apples and few people who eat grapes
- And, among the 7 people who eat grapes, there are few people who eat apples and few people who eat oranges
- Thus, while we are adding the three sets, we are counting,
- The number of people who eat both oranges and apples twice,
- The number of people who eat both oranges and grapes twice
- The number of people who eat both grapes and apples twice
- However, we need to count the above number of people only once.
- Therefore, we will delete the above number of people once from 20.
- So, we need to subtract these from 20, which gives, 20 – 3 – 4 – 5 = 8.
Now, you might wonder why we got 8, which is less than 10.
- Well, we did not count the number of people who eat all three
- Adding that, we get the total number = 8 + 2 =10
Therefore, the total number of people = the number of people who eat apples + the number of people who eat oranges + the number of people who eat grapes – the number of people who eat both apples and oranges – the number of people who eat both oranges and grapes – the number of people who eat both grapes and apples + the number of people who eat all three.
Thus, in general, we can write:
- n (A or B or C) = n(A) + n(B) + n(C) – n (A & B) – n (B & C) – n (A & C) + n (A & B & C)
- And, n (U) = n (A or B or C) + n (D)
Now, let us apply this learning to solve a simple example.
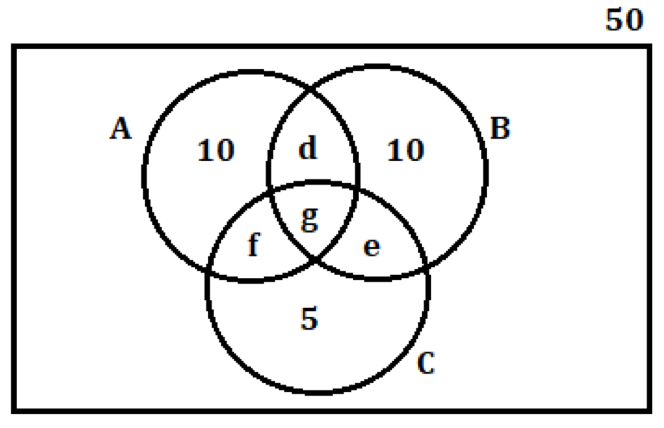
GMAT Math Example – 2
In a class of 50 students, each of them plays either Cricket or Soccer or Tennis. The number of students who play only Soccer is twice the number of students who play only Tennis. The number of students who play more than one sport are 25. If the number of students who play only cricket is 5 more than the number of students who play only tennis, then how many students play only soccer?
- 5
- 10
- 15
- 20
- 25
Understanding the question
Let us first identify the different sets mentioned in this question,
- The universal set is the students of the class.
- Among them,
- Set A is the people who play Cricket,
- Set B is the people who play Soccer, and
- Set C is the people who play Tennis
- In this question, the number of students who do not play any sport = 0, since it is given that each of them plays either Cricket, Soccer, and Tennis
Now that we have identified the sets mentioned in the question, let’s understand the information given about them
- We are told that the total number of students in the class = 50
- Among them,
- 25 students play more than one sport
- The number of students who play only cricket = Number of students who play only Tennis + 5, and
- The number of students who play only soccer = 2 * Number of students who play Tennis
- And we need to find out the number of students, who play only soccer
Draw the Venn Diagram
Now that we have understood all the information that is given to us, let’s represent this information in a three-set Venn-diagram.
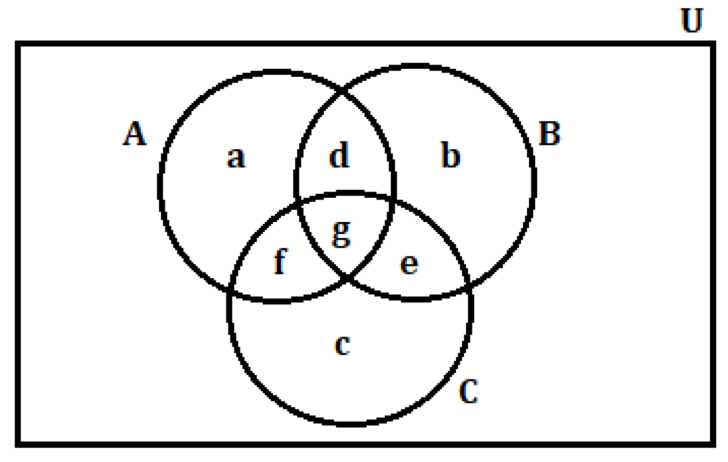
Let’s find relationships between different entities in the Venn diagram using the information given to us
- Since, each student plays at least one sport, we can say that n (U) = n (A or B or C)
- Thus,
- n(U) = n (A or B or C) = a + b + c + d + e + f + g = 50, ………. (1)
- And, we are given that the number of students who play more than one sport = the number of students who play exactly two sports + the number of students who play all the three sports = 25
- This implies, n (A & B) + n (B & C) + n (C & A) + n (A & B & C) = d + e + f + g = 25, ……………. (2)
- From equations (1) and (2), we get, a + b + c + 25 = 50
- Implies, a + b + c = 25, ……… (3)
Now, we need to express a and c in terms of b, to find the value of b.
For that, we are given that n (only soccer) = 2 * n (only tennis)
Implies, b = 2c
Thus, c = b/2
And, also n (only cricket) = n (only tennis) + 5
Implies, a = c + 5
Thus, a = (b/2) + 5
Substituting the expression of a and c in terms of b in equation (3), we get,
((b/2) + 5) + b + (b/2) = 25
- 2b = 25 – 5
- Implies, b = 10
Hence, the number of students, who play only soccer = 10
Key takeaways – How to solve GMAT Math using Venn Diagrams
- Venn Diagrams helps us to organize the given information visually. This further makes the process of establishing relations between different entities easily.
- In a two-set Venn diagram, A and B,
- n (A or B) = n (A) + n (B) – n (A & B), and
- n (U) = n (A or B) + n (D)
- In a three-set Venn diagram, A, B and C,
- n (A or B or C) = n (A) + n (B) + n (C) – n (A & B) – n (B & C) – n (C & A) + n (A & B & C), and
- n (U) = n (A or B or C) + n (D)
Want to read more GMAT Math articles?
I am sure you would have liked this article. In case you want to read more of our articles then there are 2 places where you can do so.
Happy learning.