Question
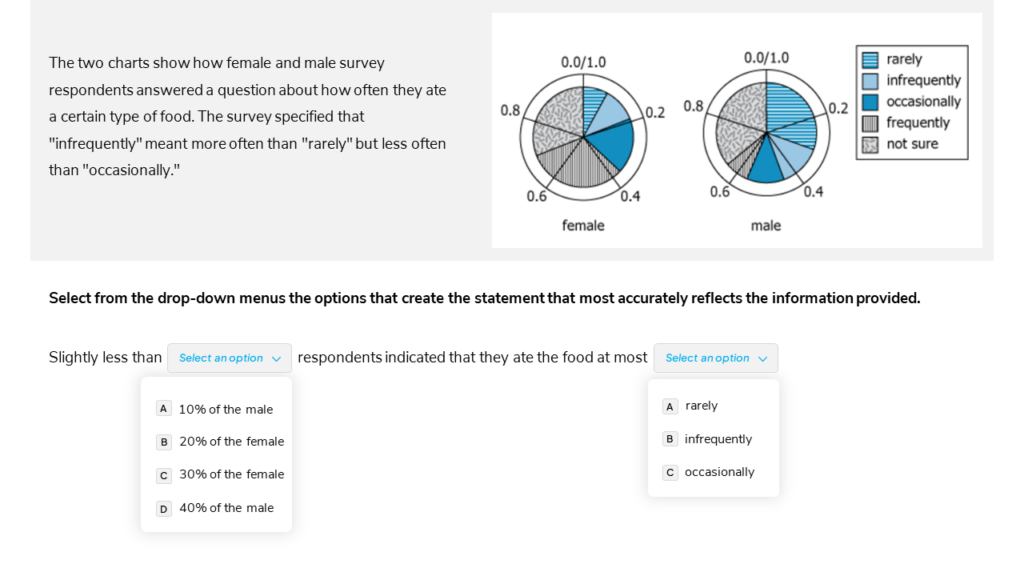
Question : The two charts show how female and male survey respondents answered a question about how often they ate a certain type of food. The survey specified that “infrequently” meant more often than “rarely” but less often than “occasionally.”
Solution : The two charts show how female and male survey..
Watch the video solution to see “owning the dataset” approach come to life on this question.
Question Attributes
- Source: Official Guide
- Difficulty Level: Hard – 33% accuracy
- Question Type: Graphic Interpretation
- Chart Type: Pie Chart
- Category: Non-Math
Helpful Links
Dive deeper into our GMAT preparation strategies and access a wealth of resources by signing up for a free trial. Click the link below to start your journey to GMAT success with e-GMAT.
- Free Trial Access
- Free GMAT Focus Mock Test
- DI Video Solutions Playlist
- GFE Success Stories
- GMAT Study Plan
Summary – The two charts show how female and male survey…
As it is GI questions are complex – given the richness of the dataset and the nature of the question – one needs to answer both questions in the question statement correctly to get the question right. And hence the key to solving all GI questions is the application of “owning the dataset” approach. That being said, this question offers certain other complexities as explained below. And as you saw in the solution, through this approach, we were able to efficiently navigate through these additional layers of complexity as well.
- The dataset presents a qualitative scale that needs to be visualized into a scale such that we can translate what “atmost rarely or infrequently or occasionally” means here.
- The question statement is worded such that we need to process both parts together. This interdependence increases the complexity of processing.
- The pie chart needs to be read and interpreted properly so that we can extract the correct information as required to answer the question asked.
To master DI questions, apply the “owning the dataset” approach that entails the following three steps:
- Thoroughly understand the dataset by actively translating, drawing inferences, and visualizing information.
- Determine the approach to solve the question asked.
- Execute the approach.
Ready to tackle the GMAT Focus Edition? e-GMAT offers a Personalized Study Planner and top-notch Free GFE mock exam to help you prepare effectively. As the most reviewed GMAT prep company on GMAT Club with 2700+ reviews we’re here to support your GFE journey. Take advantage of our free trial with the best quality content. Start your path to success today!