Introduction
Have you ever looked at a dataset and felt confident about spotting a correlation, only to have a few outliers make you second-guess yourself? You’re not alone. This common challenge trips up even well-prepared GMAT test-takers, especially when analyzing Data Interpretation questions involving correlation analysis.
The Expensive Misconception
When analyzing relationships between variables, most test-takers fall into a dangerous trap: they search for perfect patterns. This seemingly logical approach can cost you crucial points on test day. Let’s uncover why and, more importantly, how to get these questions right.
Official GMAT Question: Where Most Go Wrong
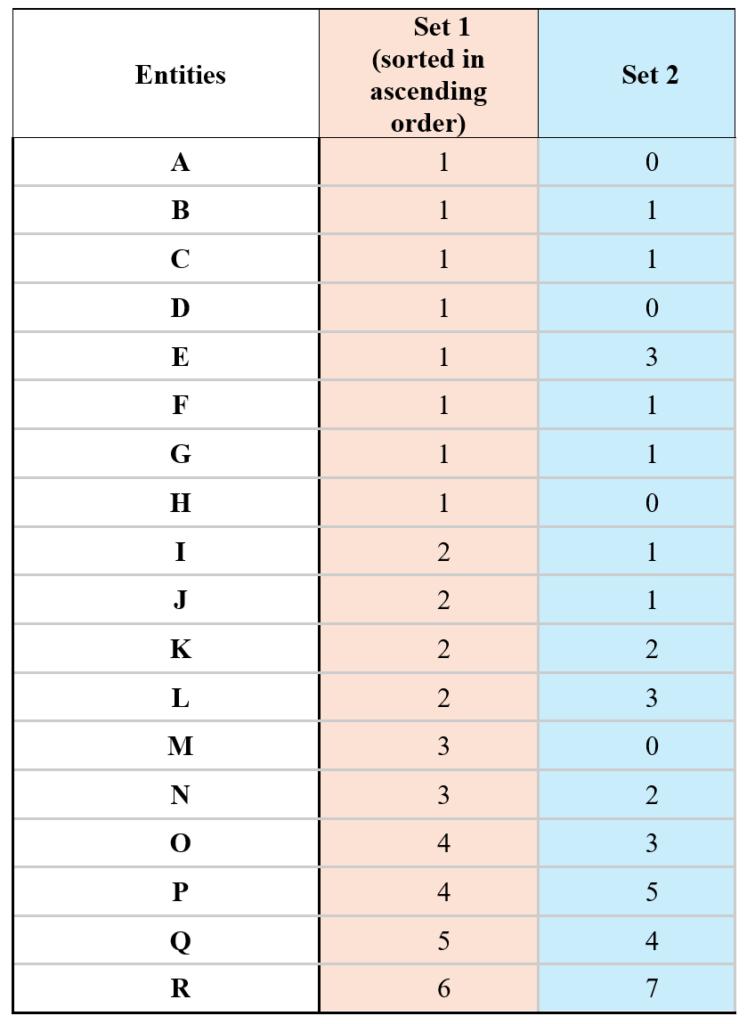
Consider this data set from an official GMAT question. Are the values in sets 1 and 2 positively correlated?
⚠️ PS: About 70% of students falter on this question.

The answer to this question is yes- values in Set 1 and Set 2 are positively correlated. Confused? Let’s solve it together.
However, before we do that, let’s understand what correlation actually means.
Understanding True Correlation
Correlation is a statistical measure that describes the strength and direction of the relationship between two variables. It indicates how much two variables tend to change together.
For example:
- Height and weight typically have a positive correlation
- Temperature and heating costs typically have a negative correlation
- Your shoe size and favorite color likely have no correlation
Now, let’s debunk the myths that lead to wrong answers:
What Correlation Is NOT:
- ❌ A perfect relationship where every pair must follow the pattern
- ❌ A rule with a maximum number of allowed exceptions
- ❌ A requirement for proportional changes
What Correlation IS:
- ✅ A general tendency for variables to move together
- ✅ An overall pattern that allows for exceptions
- ✅ Measured on a scale from -1 (perfect negative) to +1 (perfect positive)
Why The Data In The Official Example Shows Positive Correlation
Looking at our example holistically:
- Higher Set 1 values (4-6) generally correspond to higher Set 2 values (3-7)
- Lower Set 1 values (1-2) typically correspond to lower Set 2 values (0-3)
- The overall trend shows an upward pattern, despite some exceptions
In fact, when you plot these data points on a chart ( you will not be required to do that during the test), you see a very strong positive correlation (~0.8)

⏱️ Time-Saving Tip: Don’t waste time counting exceptions. Focus on the overall pattern.
Do you think Set 1 and Set 2 are positively correlated?
Key Takeaways
Remember: Approach correlation questions with confidence. You’re not looking for perfect patterns—you’re identifying tendencies. This mindset shift alone can significantly improve your accuracy on these questions. Here are things that you need to keep in mind.
- Focus on overall trends, not individual exceptions
- Look at data holistically, not pair by pair
- Remember: correlation ≠ perfection
- Trust the general pattern over specific contradictions
Exercise Question
Do you think Set 1 and Set 2 are positively correlated?

Solution:
Let us solve this step by step.
- Understanding what we’re looking for:
- In positive correlation, as one set increases, the other set tends to increase
- We need to look at the overall trend, not just individual pairs
- Not every pair needs to follow the pattern perfectly
2. Let’s analyze the data:

- Let’s look at the pattern:
- From A to D (Set 1: 1→4):
- Set 2 shows a consistent increase (0→5)
- Perfect positive correlation in this range
- At points E and F (Set 1: 5,6):
- Set 2 jumps up (12,10)
- Still higher than earlier values, maintaining a general upward trend
- Though F (10) is less than E (12), both are significantly higher than D (5)
- At point G (Set 1: 7):
- Set 2 drops to 6
- This is our main “exception”
- Analysis:
- For the first 5-6 points, there’s a clear upward trend
- Only the last point (G) significantly breaks the pattern
- Most points show that as Set 1 increases, Set 2 also increases
- The majority of the data supports a positive correlation
5. Decision: Yes, these sets are positively correlated.


