Question
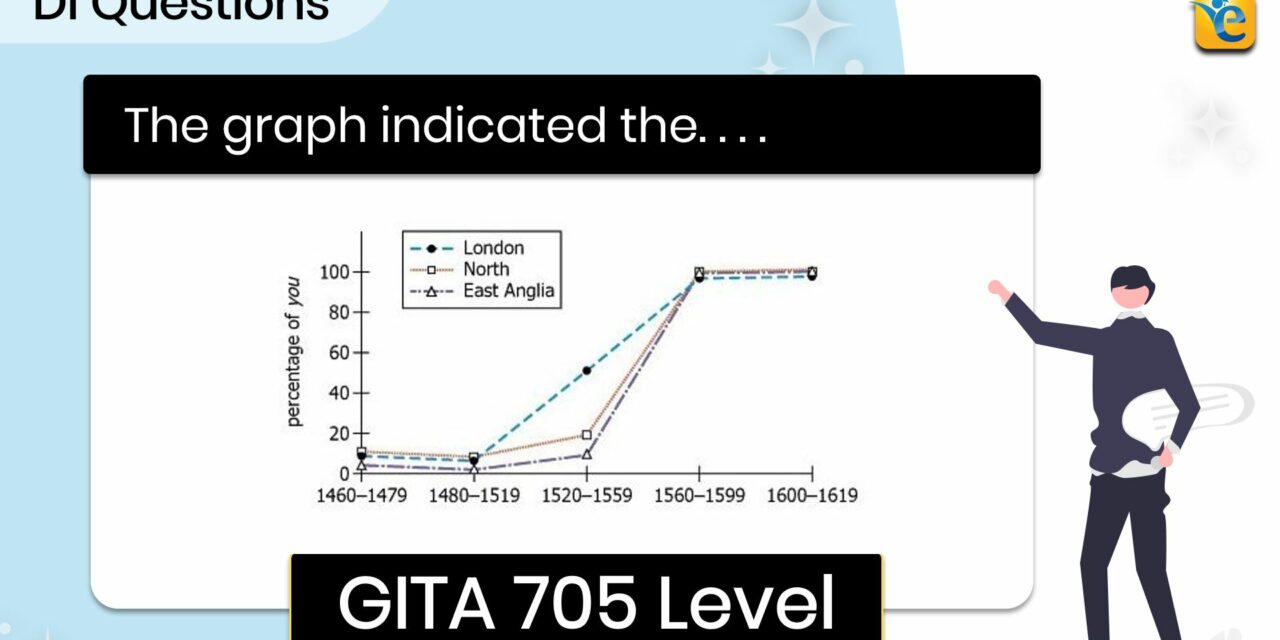
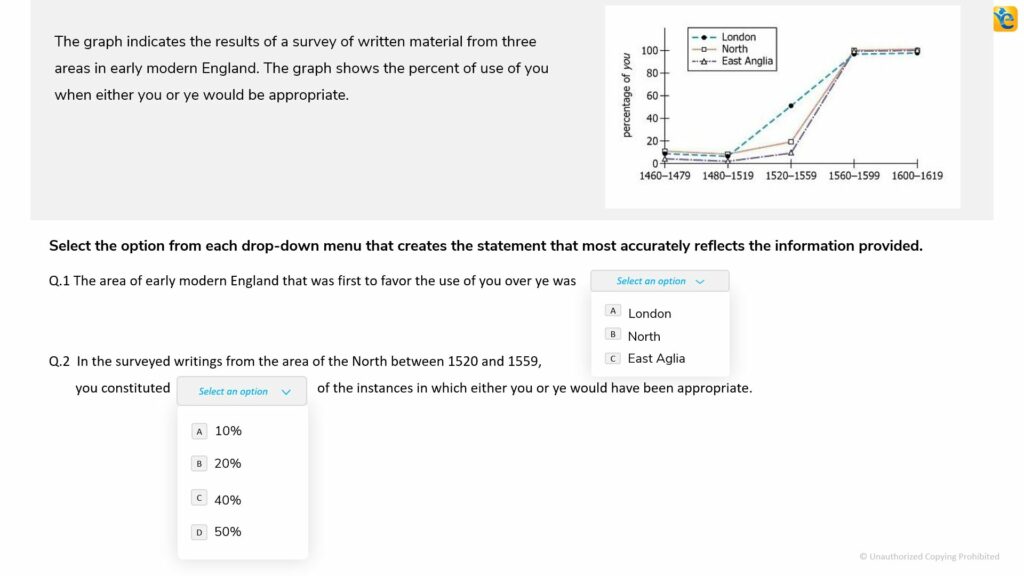
The graph indicates the results of a survey of written material from three areas in early modern England. The graph shows the percent of use of you when either you or ye would be appropriate.
Solution – The graph indicates the results of a survey . . . .
To watch the video solution to see “owning the dataset” approach come to life on this question.
Question Attributes
- Source: Official Guide 2023-24
- Difficulty Level: Hard – 62% accuracy
- Question Type: Graphics Interpretation
- Category: Math
Helpful Links
Dive deeper into our GMAT preparation strategies and access a wealth of resources by signing up for a free trial. Click the link below to start your journey to GMAT success with e-GMAT.
- Free Trial Access
- Free GMAT Focus Mock Test
- DI Video Solutions Playlist
- GFE Success Stories
- GMAT Study Plan
Summary – The graph indicates the results of a survey . . .
To master DI questions, apply the “owning the dataset” approach that entails the following three steps:
- Thoroughly understand the dataset by actively translating, drawing inferences, and visualizing information.
- Determine the approach to solve the question asked.
- Execute the approach.
Ready to tackle the GMAT Focus Edition? e-GMAT offers a Personalized Study Planner and top-notch Free GFE mock exam to help you prepare effectively. As the most reviewed GMAT prep company on GMAT Club with 2700+ reviews we’re here to support your GFE journey. Take advantage of our free trial with the best quality content. Start your path to success today!